TECHNICAL ASSET FINGERPRINT
c06d45b6fdd49d33c0256793
Click to view fullscreen
Press ESC or click to close
FOUND IN PAPERS
EXPERT: healer-alpha-free VERSION 1
RUNTIME: free/openrouter/healer-alpha
INTEL_VERIFIED
## Line Chart: Evaluation on Task
### Overview
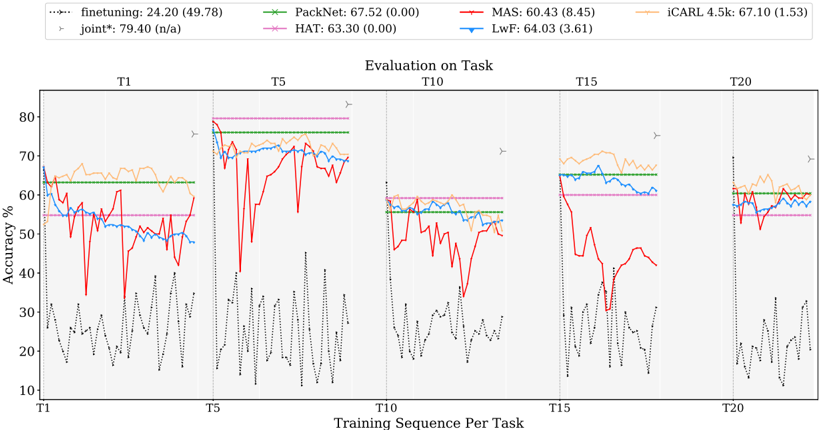
The image displays a line chart titled "Evaluation on Task," comparing the performance (accuracy percentage) of seven different machine learning methods across a sequence of training tasks. The chart is divided into five vertical sections, each corresponding to a specific task point in the training sequence (T1, T5, T10, T15, T20). The primary purpose is to visualize how each method's accuracy evolves as new tasks are learned sequentially, a common setup in continual or incremental learning research.
### Components/Axes
* **Title:** "Evaluation on Task" (centered at the top of the chart area).
* **X-Axis:** Labeled "Training Sequence Per Task". Major tick marks and labels are placed at the start of each task section: **T1, T5, T10, T15, T20**. The axis represents the progression of learning across sequential tasks.
* **Y-Axis:** Labeled "Accuracy %". The scale runs from **10 to 80**, with major gridlines at intervals of 10 (10, 20, 30, 40, 50, 60, 70, 80).
* **Legend:** Positioned at the very top of the image, spanning its width. It contains seven entries, each with a line sample, method name, and a performance metric in the format "Mean (StdDev)".
1. `finetuning: 24.20 (49.78)` - Dotted black line.
2. `PackNet: 67.52 (0.00)` - Solid green line with 'x' markers.
3. `MAS: 60.43 (8.45)` - Solid red line.
4. `iCARL 4.5k: 67.10 (1.53)` - Solid orange line.
5. `joint*: 79.40 (n/a)` - Dotted gray line with right-pointing triangle markers (`>`). This appears as a horizontal reference line.
6. `HAT: 63.30 (0.00)` - Solid magenta/pink line.
7. `LwF: 64.03 (3.61)` - Solid blue line.
* **Chart Area:** Contains the plotted lines for each method. Vertical dashed lines separate the five task sections (T1, T5, T10, T15, T20).
### Detailed Analysis
**Trend Verification & Data Series Analysis (by method):**
1. **finetuning (Dotted Black Line):**
* **Trend:** Highly volatile and consistently the lowest-performing method. Shows large, rapid fluctuations within each task section.
* **Data Points (Approximate):** Accuracy oscillates roughly between **10% and 40%** across all tasks. No clear upward or downward trend; performance remains poor and unstable.
2. **PackNet (Solid Green Line with 'x' markers):**
* **Trend:** Extremely stable, appearing as a near-perfect horizontal line within each task section. Performance is consistent across tasks.
* **Data Points (Approximate):** Maintains an accuracy of approximately **63-67%** throughout. The legend's mean of 67.52 with 0.00 std dev aligns with this visual flatness.
3. **MAS (Solid Red Line):**
* **Trend:** Shows significant instability, particularly a dramatic drop and recovery pattern. It starts relatively high, crashes sharply after T5, and then partially recovers in later tasks.
* **Data Points (Approximate):** At T1, starts around **65%**. After T5, it plummets to near **30%** before recovering to the **40-50%** range in T10-T15, ending near **60%** at T20.
4. **iCARL 4.5k (Solid Orange Line):**
* **Trend:** Generally stable with a slight downward drift over the sequence. It is one of the top performers initially but shows gradual degradation.
* **Data Points (Approximate):** Begins near **70%** at T1. Fluctuates between **60-70%** across tasks, ending slightly lower near **60%** at T20.
5. **joint* (Dotted Gray Line with '>' markers):**
* **Trend:** A flat, horizontal reference line at the top of the chart. Represents an upper-bound baseline (likely training on all tasks jointly).
* **Data Points:** Constant at **79.40%** across the entire x-axis.
6. **HAT (Solid Magenta/Pink Line):**
* **Trend:** Very stable, similar to PackNet. Appears as a horizontal line with minimal variation.
* **Data Points (Approximate):** Maintains an accuracy of approximately **63%** consistently, matching its legend mean of 63.30.
7. **LwF (Solid Blue Line):**
* **Trend:** Moderately stable with some fluctuations, generally performing in the middle of the pack.
* **Data Points (Approximate):** Hovers in the **55-65%** range across all tasks, with a slight dip in the T10 section.
**Spatial Grounding:** The legend is placed at the top, outside the plot area. Within the plot, the `joint*` reference line is the highest element. The `finetuning` line occupies the lowest region. The other methods are clustered in the **50-70%** band, with `PackNet` and `HAT` forming the most stable "floor" within that cluster, and `iCARL` often forming the "ceiling" of the main group before its slight decline.
### Key Observations
1. **Performance Hierarchy:** A clear hierarchy is visible: `joint*` (upper bound) > `iCARL`/`PackNet`/`HAT`/`LwF` (main cluster) > `MAS` (unstable) > `finetuning` (poor).
2. **Stability vs. Plasticity:** Methods like `PackNet` and `HAT` show almost zero forgetting (flat lines), indicating strong stability. `MAS` exhibits severe catastrophic forgetting (sharp drop) followed by some recovery. `finetuning` shows extreme instability.
3. **Task Boundary Impact:** The vertical dashed lines marking new tasks (T5, T10, etc.) often coincide with shifts or increased volatility in several lines, most notably the crash in `MAS` after T5.
4. **Convergence:** By the final task (T20), the performance of the main cluster (`iCARL`, `PackNet`, `HAT`, `LwF`) converges to a narrower range around **60-65%**, while `MAS` recovers to join them.
### Interpretation
This chart is a classic evaluation of **continual learning** algorithms, which aim to learn a sequence of tasks without forgetting previous ones (catastrophic forgetting).
* **What the data suggests:** The `joint*` line represents the ideal scenario where the model has access to all data at once. The significant gap between `joint*` and all other methods highlights the inherent difficulty of continual learning.
* **How elements relate:** The stability of `PackNet` and `HAT` suggests they employ strong mechanisms (like parameter isolation or hard attention) to protect knowledge from old tasks. The volatility of `MAS` (Memory Aware Synapses) indicates its regularization approach may be less robust to this specific task sequence. The poor performance of `finetuning` (simply updating the model on new data) demonstrates the necessity of specialized continual learning techniques.
* **Notable Anomalies:** The dramatic failure and partial recovery of `MAS` is the most striking anomaly. It suggests a critical point (after T5) where its knowledge protection mechanism was overwhelmed, but it managed to relearn or stabilize later. The slight decline of `iCARL` (a replay-based method) might indicate a gradual buffer saturation or interference as more tasks are added.
* **Underlying Message:** The chart argues that while specialized methods (`PackNet`, `HAT`, `iCARL`) significantly outperform naive `finetuning`, they still fall short of the joint training upper bound. The choice of method involves a trade-off between stability (flat lines like `PackNet`) and plasticity (ability to learn new tasks, which might cause some fluctuation).
DECODING INTELLIGENCE...