## Line Graph: Evaluation on Task
### Overview
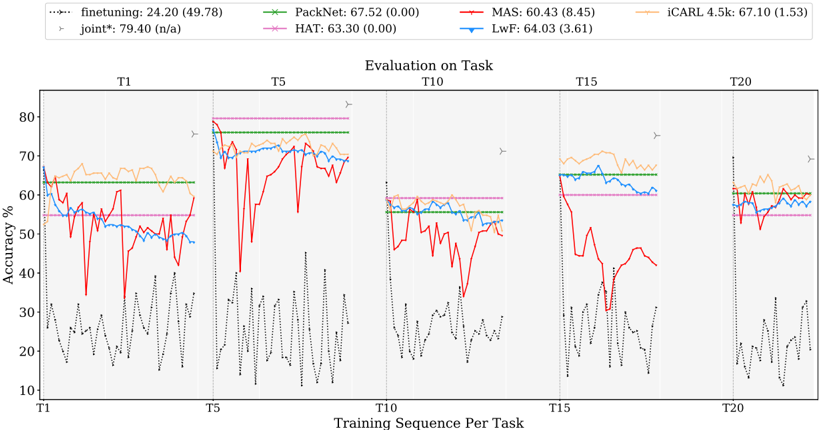
The image is a multi-line graph comparing the accuracy performance of various machine learning methods across sequential training tasks (T1 to T20). The graph shows accuracy percentages on the y-axis and training sequence per task on the x-axis. Multiple data series are plotted with distinct line styles and colors, accompanied by a legend at the top.
### Components/Axes
- **X-axis**: "Training Sequence Per Task" with discrete labels: T1, T5, T10, T15, T20
- **Y-axis**: "Accuracy %" with a scale from 10% to 80%
- **Legend**: Located at the top-left, containing 7 entries:
- `finetuning`: Dashed black line (24.20 (49.78))
- `PackNet`: Solid green line (67.52 (0.00))
- `MAS`: Solid red line (60.43 (8.45))
- `iCARL 4.5k`: Solid orange line (67.10 (1.53))
- `LwF`: Solid blue line (64.03 (3.61))
- `HAT`: Solid pink line (63.30 (0.00))
- `joint*`: Dotted black line with star marker (79.40 (n/a))
- **Annotations**:
- Arrow symbols (▶) at T5 and T20
- Vertical dashed lines at T5, T10, T15, T20
### Detailed Analysis
1. **finetuning** (dashed black):
- Starts at ~60% at T1, drops sharply to ~20% at T5, then fluctuates between 30-50% until T20
- Final accuracy: ~49.78% (high variance)
2. **PackNet** (solid green):
- Stable performance around 65-70% across all tasks
- Minimal variance (0.00)
3. **MAS** (solid red):
- Peaks at ~75% at T1, then drops to ~40% at T5
- Recovers to ~60% by T15, then declines to ~50% at T20
- High variance (8.45)
4. **iCARL 4.5k** (solid orange):
- Consistent ~65-70% performance with slight fluctuations
- Final accuracy: 67.10% (low variance: 1.53)
5. **LwF** (solid blue):
- Starts at ~60% at T1, rises to ~70% at T5
- Drops to ~55% at T10, recovers to ~65% by T20
- Moderate variance (3.61)
6. **HAT** (solid pink):
- Flat line at ~63.30% with no variance (0.00)
7. **joint*** (dotted black with star):
- Dominates at T1 with 79.40% accuracy
- Drops sharply to ~50% at T5, then fluctuates between 50-60% until T20
- No variance metric provided (n/a)
### Key Observations
- **Initial Performance**: `joint*` achieves the highest accuracy at T1 (79.40%) but degrades significantly over time
- **Stability**: `PackNet` and `HAT` maintain the most consistent performance (low variance)
- **Recovery Patterns**: `iCARL 4.5k` and `LwF` show partial recovery after initial drops
- **Anomalies**:
- `finetuning` exhibits extreme volatility (60% → 20% → 30-50%)
- `MAS` has the largest variance (8.45) despite moderate final performance
### Interpretation
The graph demonstrates a trade-off between initial performance and long-term stability. While `joint*` achieves the best initial results, its performance degrades more severely than other methods over sequential tasks. Methods like `PackNet` and `HAT` prioritize consistency over peak performance, maintaining stable accuracy with minimal variance. The arrows at T5 and T20 likely indicate task transitions or evaluation checkpoints, with performance dips correlating to these points. The absence of variance metrics for `joint*` suggests either measurement limitations or inherent instability in its implementation. This pattern implies that while specialized models (e.g., `joint*`) may excel in specific scenarios, generalist approaches (`PackNet`, `HAT`) offer more reliable long-term performance.