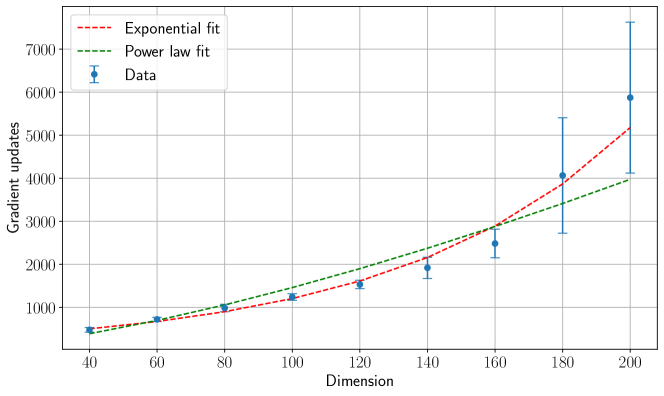
## Chart: Gradient Updates vs. Dimension
### Overview
The image is a scatter plot showing the relationship between "Gradient updates" and "Dimension". The plot includes data points with error bars, along with an exponential fit and a power law fit to the data. The x-axis represents "Dimension" ranging from 40 to 200, and the y-axis represents "Gradient updates" ranging from 0 to 7000.
### Components/Axes
* **X-axis:** Dimension, ranging from 40 to 200 in increments of 20.
* **Y-axis:** Gradient updates, ranging from 0 to 7000 in increments of 1000.
* **Data Points:** Blue data points with error bars.
* **Exponential Fit:** Red dashed line representing an exponential fit to the data.
* **Power Law Fit:** Green dashed line representing a power law fit to the data.
* **Legend (Top-Left):**
* Red dashed line: Exponential fit
* Green dashed line: Power law fit
* Blue data points: Data
### Detailed Analysis
* **Data Points:**
* Dimension 40: Gradient updates ~450 +/- 100
* Dimension 60: Gradient updates ~700 +/- 100
* Dimension 80: Gradient updates ~1000 +/- 100
* Dimension 100: Gradient updates ~1250 +/- 100
* Dimension 120: Gradient updates ~1550 +/- 100
* Dimension 140: Gradient updates ~1950 +/- 200
* Dimension 160: Gradient updates ~2300 +/- 200
* Dimension 180: Gradient updates ~4100 +/- 1000
* Dimension 200: Gradient updates ~5900 +/- 1200
* **Exponential Fit (Red Dashed Line):** The exponential fit starts around 400 at dimension 40 and increases exponentially, reaching approximately 5200 at dimension 200.
* **Power Law Fit (Green Dashed Line):** The power law fit starts around 400 at dimension 40 and increases, reaching approximately 4100 at dimension 200.
### Key Observations
* Both the exponential and power law fits start at approximately the same point at dimension 40.
* The data points generally increase with dimension, but there is significant variance, especially at higher dimensions, as indicated by the large error bars.
* The exponential fit appears to overestimate the gradient updates at higher dimensions compared to the power law fit.
* The error bars for the data points at dimensions 180 and 200 are significantly larger than the error bars for the other data points.
### Interpretation
The chart illustrates how the number of gradient updates changes with the dimension of the data. The exponential and power law fits provide models for this relationship. The increasing variance in gradient updates at higher dimensions suggests that the relationship becomes less predictable as the dimension increases. The exponential fit grows faster than the power law fit, indicating that an exponential model might be more sensitive to changes in dimension. The large error bars at higher dimensions could be due to various factors, such as increased complexity or instability in the gradient updates. The data suggests that the number of gradient updates required increases with dimension, but the precise nature of this relationship is subject to uncertainty, especially at higher dimensions.