## Chart: Gradient Updates vs. Dimension
### Overview
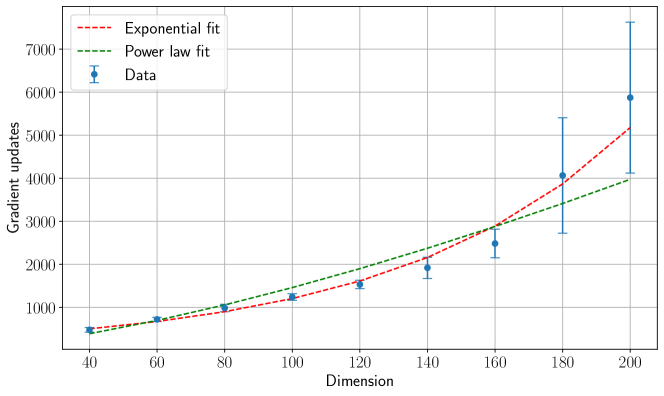
The image presents a line chart illustrating the relationship between the dimension of a space and the number of gradient updates required during an optimization process. The chart compares empirical data with two fitted curves: an exponential fit and a power law fit. Error bars are included for the data points, indicating the variability in the gradient update counts.
### Components/Axes
* **X-axis:** Dimension, ranging from approximately 40 to 200. Axis markers are present at intervals of 20.
* **Y-axis:** Gradient updates, ranging from approximately 0 to 7000. Axis markers are present at intervals of 1000.
* **Legend:** Located in the top-left corner.
* "Data" - Represented by blue data points with error bars.
* "Exponential fit" - Represented by a red dashed line.
* "Power law fit" - Represented by a green dashed line.
* **Grid:** A light gray grid is overlaid on the chart for easier readability.
### Detailed Analysis
The chart displays three data series: the empirical data, the exponential fit, and the power law fit.
* **Data (Blue):** The data points show an increasing trend. The number of gradient updates increases as the dimension increases. Error bars are present at each data point, indicating the variance in the gradient updates.
* Dimension = 40, Gradient Updates = approximately 400, Error = approximately 50
* Dimension = 60, Gradient Updates = approximately 500, Error = approximately 50
* Dimension = 80, Gradient Updates = approximately 750, Error = approximately 75
* Dimension = 100, Gradient Updates = approximately 1000, Error = approximately 100
* Dimension = 120, Gradient Updates = approximately 1300, Error = approximately 100
* Dimension = 140, Gradient Updates = approximately 1600, Error = approximately 100
* Dimension = 160, Gradient Updates = approximately 2300, Error = approximately 200
* Dimension = 180, Gradient Updates = approximately 3500, Error = approximately 300
* Dimension = 200, Gradient Updates = approximately 6400, Error = approximately 600
* **Exponential Fit (Red):** The exponential fit line starts at approximately 400 at dimension 40 and increases at an accelerating rate, reaching approximately 5000 at dimension 200.
* **Power Law Fit (Green):** The power law fit line also shows an increasing trend, but the rate of increase is slower than the exponential fit. It starts at approximately 400 at dimension 40 and reaches approximately 3800 at dimension 200.
### Key Observations
* The number of gradient updates appears to increase non-linearly with dimension.
* The exponential fit seems to better capture the trend of the data at higher dimensions (around 160-200), while the power law fit is closer to the data at lower dimensions.
* The error bars indicate significant variability in the gradient updates, especially at higher dimensions.
* The data points show a clear upward trend, suggesting that optimization becomes more difficult as the dimension increases.
### Interpretation
The chart suggests that the computational cost of optimization (as measured by the number of gradient updates) increases with the dimensionality of the problem space. The comparison of the exponential and power law fits indicates that the relationship is likely non-polynomial. The better fit of the exponential curve at higher dimensions suggests that the computational cost may grow exponentially with dimension, which could pose a significant challenge for high-dimensional optimization problems. The error bars highlight the inherent stochasticity in the optimization process, and the variability in the number of gradient updates. This could be due to factors such as the initialization of the optimization algorithm, the choice of learning rate, or the inherent complexity of the optimization landscape. The chart provides valuable insights into the scaling behavior of optimization algorithms in high-dimensional spaces, and can inform the development of more efficient optimization techniques.