## Line Graph: Gradient Updates vs. Dimension
### Overview
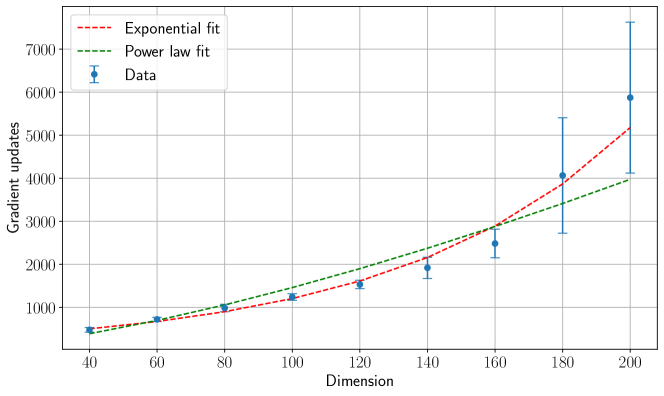
The graph compares two mathematical models ("Exponential fit" and "Power law fit") against empirical data points ("Data") to illustrate how gradient updates scale with increasing dimension. The x-axis represents dimension (40–200), and the y-axis represents gradient updates (0–7000). The legend is positioned in the top-left corner, with red dashed lines for the exponential model, green dashed lines for the power law model, and blue markers with error bars for observed data.
---
### Components/Axes
- **X-axis (Dimension)**: Labeled "Dimension," with ticks at 40, 60, 80, 100, 120, 140, 160, 180, and 200.
- **Y-axis (Gradient updates)**: Labeled "Gradient updates," with increments of 1000 (0, 1000, 2000, ..., 7000).
- **Legend**: Top-left corner, with:
- Red dashed line: "Exponential fit"
- Green dashed line: "Power law fit"
- Blue markers: "Data" (with error bars)
---
### Detailed Analysis
1. **Exponential Fit (Red Dashed Line)**:
- Starts slightly above the power law fit at dimension 40 (~500 gradient updates).
- Slope increases steadily, surpassing the power law fit by dimension 100.
- At dimension 200, reaches ~5000 gradient updates.
- Error bars are absent for this model.
2. **Power Law Fit (Green Dashed Line)**:
- Begins slightly below the exponential fit at dimension 40 (~400 gradient updates).
- Slope increases more gradually than the exponential fit.
- At dimension 200, reaches ~4000 gradient updates.
- Error bars are absent for this model.
3. **Data Points (Blue Markers)**:
- Plotted at dimensions 40, 60, 80, 100, 120, 140, 160, 180, and 200.
- Values align closely with the exponential fit, especially at higher dimensions.
- Error bars increase in size at higher dimensions:
- Dimension 40: ±50
- Dimension 60: ±70
- Dimension 80: ±100
- Dimension 100: ±150
- Dimension 120: ±200
- Dimension 140: ±250
- Dimension 160: ±300
- Dimension 180: ±400
- Dimension 200: ±600
---
### Key Observations
- The exponential fit consistently predicts higher gradient updates than the power law fit across all dimensions.
- Data points align more closely with the exponential fit, particularly at dimensions ≥100.
- Error bars grow significantly at higher dimensions, suggesting reduced measurement precision or increased variability in gradient updates as dimension increases.
---
### Interpretation
The data strongly supports the exponential model as a better predictor of gradient updates in high-dimensional spaces. The power law fit underestimates updates, especially beyond dimension 100. The widening error bars at higher dimensions imply that gradient updates become harder to measure or predict accurately as systems scale. This could reflect challenges in optimization algorithms (e.g., training neural networks) where computational complexity grows exponentially with dimension, or it may indicate noise in data collection at scale. The divergence between models highlights the importance of selecting appropriate scaling laws for high-dimensional problems.