## Line Graph: Accuracy Comparison: Generation vs Multiple-choice Methods
### Overview
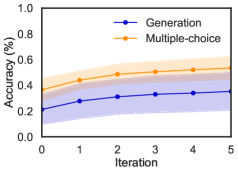
The image is a line graph comparing the accuracy of two methods ("Generation" and "Multiple-choice") across five iterations. Accuracy is measured on the y-axis (0% to 100%), and iterations are on the x-axis (0 to 5). Shaded regions around the lines represent confidence intervals.
### Components/Axes
- **X-axis (Horizontal)**: Labeled "Iteration" with markers at 0, 1, 2, 3, 4, 5.
- **Y-axis (Vertical)**: Labeled "Accuracy (%)" with markers at 0.0, 0.2, 0.4, 0.6, 0.8, 1.0.
- **Legend**: Located in the top-right corner.
- **Blue line with circles**: "Generation"
- **Orange line with circles**: "Multiple-choice"
- **Shaded Regions**: Gray for "Generation," light orange for "Multiple-choice," indicating variability/confidence intervals.
### Detailed Analysis
1. **Generation (Blue Line)**:
- Starts at ~0.2% accuracy at iteration 0.
- Increases gradually to ~0.35% by iteration 5.
- Shaded region widens early (iterations 0–2) and narrows slightly later, suggesting higher variability in early iterations.
2. **Multiple-choice (Orange Line)**:
- Starts at ~0.4% accuracy at iteration 0.
- Rises steadily to ~0.55% by iteration 5.
- Shaded region remains consistently narrow, indicating stable performance.
3. **Trends**:
- Both methods show upward trends, but "Multiple-choice" maintains higher accuracy throughout.
- The gap between the two methods narrows slightly from iteration 0 (0.2% difference) to iteration 5 (~0.2% difference), though "Multiple-choice" remains superior.
### Key Observations
- "Multiple-choice" consistently outperforms "Generation" across all iterations.
- "Generation" shows a steeper improvement rate but starts from a lower baseline.
- Confidence intervals for "Generation" are broader, especially in early iterations, indicating less reliability.
### Interpretation
The data suggests that "Multiple-choice" methods are more accurate and reliable than "Generation" methods in this context. While "Generation" demonstrates potential for improvement with more iterations, its current performance is less consistent. The narrowing gap implies that "Generation" could approach "Multiple-choice" performance with further refinement, but the shaded regions highlight persistent uncertainty in its results. This could inform decisions about prioritizing "Multiple-choice" for critical applications or investing in optimizing "Generation" methods.