\n
## Line Chart: Accuracy vs. Iteration for Generation and Multiple-Choice Tasks
### Overview
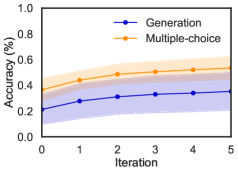
This image presents a line chart comparing the accuracy of two tasks – "Generation" and "Multiple-choice" – over five iterations. The chart displays the mean accuracy and a shaded region representing the standard deviation or confidence interval around the mean.
### Components/Axes
* **X-axis:** "Iteration", ranging from 0 to 5.
* **Y-axis:** "Accuracy (%)", ranging from 0.0 to 1.0.
* **Data Series 1:** "Generation" – represented by a blue line with circular markers.
* **Data Series 2:** "Multiple-choice" – represented by an orange line with circular markers.
* **Legend:** Located in the top-right corner, labeling the two data series with their corresponding colors.
* **Shaded Regions:** Light blue and light orange areas surrounding each line, indicating the variability or confidence interval.
### Detailed Analysis
**Generation (Blue Line):**
The blue line representing "Generation" accuracy shows an upward trend, but the increase is relatively small.
* Iteration 0: Approximately 0.24 accuracy.
* Iteration 1: Approximately 0.28 accuracy.
* Iteration 2: Approximately 0.32 accuracy.
* Iteration 3: Approximately 0.34 accuracy.
* Iteration 4: Approximately 0.35 accuracy.
* Iteration 5: Approximately 0.36 accuracy.
The shaded region around the blue line indicates a relatively wide range of variability, particularly at lower iteration values.
**Multiple-choice (Orange Line):**
The orange line representing "Multiple-choice" accuracy shows a downward trend, but the decrease is also relatively small.
* Iteration 0: Approximately 0.52 accuracy.
* Iteration 1: Approximately 0.48 accuracy.
* Iteration 2: Approximately 0.45 accuracy.
* Iteration 3: Approximately 0.44 accuracy.
* Iteration 4: Approximately 0.45 accuracy.
* Iteration 5: Approximately 0.46 accuracy.
The shaded region around the orange line also indicates variability, but it appears slightly more consistent than the blue line's variability.
### Key Observations
* The "Multiple-choice" task starts with a significantly higher accuracy than the "Generation" task.
* The "Generation" task's accuracy increases with iteration, while the "Multiple-choice" task's accuracy decreases slightly.
* Both tasks exhibit a relatively small change in accuracy across the five iterations.
* The confidence intervals (shaded regions) are relatively wide, suggesting considerable variability in the results.
### Interpretation
The data suggests that while the "Generation" task benefits from iterative improvement, the gains are modest. Conversely, the "Multiple-choice" task shows a slight decline in accuracy with iteration, potentially indicating overfitting or a saturation point. The wide confidence intervals suggest that the observed trends might not be statistically significant, or that there is substantial variation in performance across different runs or conditions.
The difference in initial accuracy between the two tasks could be due to the inherent difficulty of the tasks themselves. "Multiple-choice" tasks are generally easier to perform accurately than "Generation" tasks, which require more creative and complex reasoning. The convergence of the two lines over iterations suggests that the "Generation" task is approaching the performance level of the "Multiple-choice" task, but it is still lagging behind. Further investigation would be needed to determine the underlying causes of these trends and to assess the statistical significance of the observed differences.