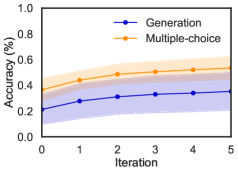
## Line Chart: Accuracy vs. Iteration for Two Methods
### Overview
The image is a line chart comparing the accuracy performance of two methods, "Generation" and "Multiple-choice," over a series of iterations. The chart includes shaded regions around each line, likely representing confidence intervals or standard deviation.
### Components/Axes
* **Chart Type:** Line chart with shaded error bands.
* **X-Axis:**
* **Label:** "Iteration"
* **Scale:** Linear, from 0 to 5.
* **Markers:** 0, 1, 2, 3, 4, 5.
* **Y-Axis:**
* **Label:** "Accuracy (%)"
* **Scale:** Linear, from 0.0 to 1.0 (representing 0% to 100%).
* **Markers:** 0.0, 0.2, 0.4, 0.6, 0.8, 1.0.
* **Legend:**
* **Position:** Top-left corner of the plot area.
* **Items:**
1. **Blue line with circle markers:** "Generation"
2. **Orange line with diamond markers:** "Multiple-choice"
### Detailed Analysis
**Data Series 1: Generation (Blue Line)**
* **Trend:** The line shows a steady, gradual upward slope from left to right.
* **Approximate Data Points:**
* Iteration 0: ~0.25 (25%)
* Iteration 1: ~0.28
* Iteration 2: ~0.30
* Iteration 3: ~0.32
* Iteration 4: ~0.34
* Iteration 5: ~0.35 (35%)
* **Shaded Region (Blue):** A relatively narrow band surrounds the line, indicating lower variance or a tighter confidence interval. The band spans approximately ±0.05 to ±0.08 in accuracy around the central line.
**Data Series 2: Multiple-choice (Orange Line)**
* **Trend:** The line also shows a steady upward slope, positioned consistently above the blue line.
* **Approximate Data Points:**
* Iteration 0: ~0.45 (45%)
* Iteration 1: ~0.48
* Iteration 2: ~0.50
* Iteration 3: ~0.52
* Iteration 4: ~0.54
* Iteration 5: ~0.55 (55%)
* **Shaded Region (Orange):** A wider band surrounds this line, indicating greater variance or a broader confidence interval. The band spans approximately ±0.10 to ±0.15 in accuracy around the central line.
### Key Observations
1. **Performance Gap:** The "Multiple-choice" method demonstrates consistently higher accuracy than the "Generation" method at every measured iteration. The gap is approximately 20 percentage points at iteration 0 and narrows slightly to about 20 percentage points at iteration 5.
2. **Positive Trend:** Both methods show improvement in accuracy as the number of iterations increases.
3. **Variance Difference:** The "Multiple-choice" method exhibits significantly higher variance (wider shaded area) in its performance compared to the "Generation" method, which has a more consistent output (narrower shaded area).
4. **Convergence:** The slopes of the two lines appear roughly parallel, suggesting the rate of improvement per iteration is similar for both methods.
### Interpretation
The data suggests that for the task being measured, employing a "Multiple-choice" approach yields a substantial and consistent accuracy advantage over a "Generation" approach across the observed training or evaluation iterations. Both methods benefit from more iterations, indicating a learning or refinement process.
The key trade-off highlighted is between **performance and consistency**. While "Multiple-choice" achieves higher average accuracy, its results are more variable, as shown by the wider confidence band. This could imply that its success is more sensitive to specific conditions or data samples. In contrast, "Generation" is less accurate on average but produces more reliable and predictable outcomes.
From a technical standpoint, this chart would be critical for deciding which method to deploy. If the priority is maximizing peak accuracy and some variability is acceptable, "Multiple-choice" is superior. If stable, predictable performance is paramount, "Generation" might be preferred despite its lower average score. The parallel improvement trends suggest that further iterations could continue to benefit both methods, but the fundamental performance gap between them is likely to persist.