# Technical Document Extraction: Accuracy Distribution Analysis
## 1. Document Metadata
* **Title:** Accuracy Distribution by Race, Gender, and Bias
* **Language:** English
* **Chart Type:** Grouped Box Plot (Facet Grid)
* **Primary Variables:**
* **Accuracy** (Y-axis, continuous 0.0 to 1.0)
* **Race** (X-axis, categorical: Black, White, Other Race, Hispanic, Asian)
* **Gender** (Legend/Color: Male, Female)
* **Bias Group** (Facet/Sub-plot: False, True)
---
## 2. Component Isolation
### Header
* **Main Title:** Accuracy Distribution by Race, Gender, and Bias
* **Sub-titles:**
* Left Plot: `Bias Group = False`
* Right Plot: `Bias Group = True`
### Legend (Spatial Placement: Top Right of the right-hand plot)
* **Title:** Gender
* **Light Blue (#B9CFE0):** Male
* **Dark Blue (#4E84B0):** Female
### Axis Definitions
* **Y-Axis (Left of both plots):** Label: "Accuracy". Markers: 0.0, 0.2, 0.4, 0.6, 0.8, 1.0.
* **X-Axis (Bottom of both plots):** Label: "Race". Categories: Black, White, Other Race, Hispanic, Asian.
---
## 3. Data Extraction and Trend Analysis
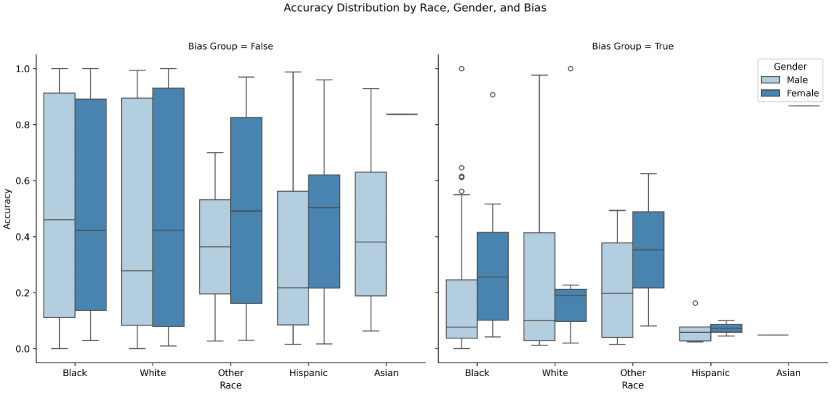
### Sub-plot 1: Bias Group = False
**General Trend:** Accuracy is significantly higher across all racial groups compared to the "Bias Group = True" condition. Medians generally fall between 0.2 and 0.5.
| Race | Gender | Median Accuracy (Approx) | Interquartile Range (IQR) | Whiskers/Outliers |
| :--- | :--- | :--- | :--- | :--- |
| **Black** | Male | 0.46 | ~0.12 to 0.91 | 0.0 to 1.0 |
| | Female | 0.42 | ~0.14 to 0.89 | 0.03 to 1.0 |
| **White** | Male | 0.28 | ~0.08 to 0.90 | 0.0 to 0.99 |
| | Female | 0.42 | ~0.08 to 0.93 | 0.01 to 1.0 |
| **Other Race**| Male | 0.37 | ~0.20 to 0.53 | 0.03 to 0.70 |
| | Female | 0.49 | ~0.16 to 0.83 | 0.03 to 0.97 |
| **Hispanic** | Male | 0.22 | ~0.09 to 0.56 | 0.02 to 0.99 |
| | Female | 0.50 | ~0.22 to 0.62 | 0.02 to 0.96 |
| **Asian** | Male | 0.38 | ~0.19 to 0.63 | 0.06 to 0.93 |
| | Female | ~0.84 | N/A (Single line) | No whiskers shown |
### Sub-plot 2: Bias Group = True
**General Trend:** Accuracy drops drastically. Most medians fall below 0.2. There is a high concentration of outliers in the "Black" category and a significant collapse in performance for "Hispanic" and "Asian" groups.
| Race | Gender | Median Accuracy (Approx) | Interquartile Range (IQR) | Whiskers/Outliers |
| :--- | :--- | :--- | :--- | :--- |
| **Black** | Male | 0.08 | ~0.04 to 0.25 | Whiskers to ~0.55; Outliers at ~0.56, 0.61, 0.62, 0.65, 1.0 |
| | Female | 0.26 | ~0.10 to 0.42 | 0.04 to 0.52; Outlier at ~0.91 |
| **White** | Male | 0.10 | ~0.03 to 0.42 | 0.01 to 0.98 |
| | Female | 0.19 | ~0.10 to 0.21 | 0.02 to 0.23; Outlier at 1.0 |
| **Other Race**| Male | 0.20 | ~0.04 to 0.38 | 0.01 to 0.49 |
| | Female | 0.35 | ~0.22 to 0.49 | 0.08 to 0.63 |
| **Hispanic** | Male | 0.06 | ~0.03 to 0.08 | 0.02 to 0.08; Outlier at ~0.17 |
| | Female | 0.08 | ~0.05 to 0.09 | 0.04 to 0.10 |
| **Asian** | Male | ~0.05 | N/A (Single line) | No whiskers shown |
| | Female | N/A | No data shown | No data shown |
---
## 4. Key Observations & Logic Check
1. **Bias Impact:** The introduction of "Bias Group = True" causes a visible downward shift in the entire distribution of accuracy scores across almost all demographics.
2. **Gender Disparity:** In the "Bias Group = True" condition, Females generally maintain a higher median accuracy than Males in the Black, White, and Other Race categories.
3. **Data Sparsity:** The "Asian" category in both plots and the "Hispanic" category in the "Bias Group = True" plot show very narrow IQRs or single lines, suggesting a much smaller sample size for these specific intersections.
4. **Outlier Presence:** The "Black Male" and "Black Female" categories under "Bias Group = True" show significant upward outliers, indicating that while the majority of the group has low accuracy, a small subset achieves very high accuracy (up to 1.0).