# Technical Document Extraction: Accuracy Distribution by Race, Gender, and Bias
## Image Description
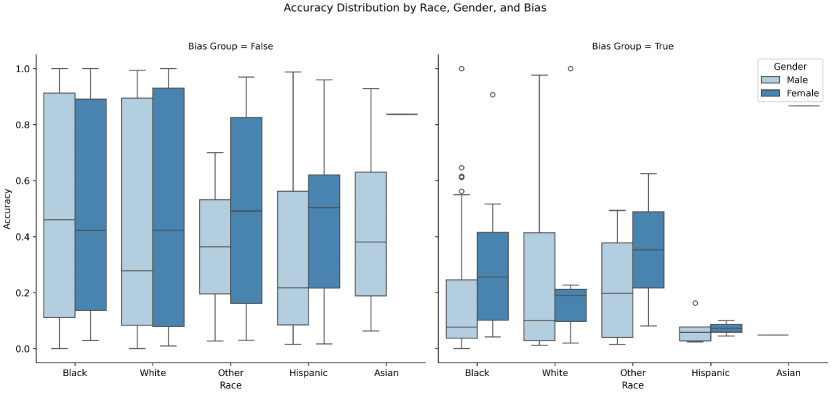
The image contains two side-by-side box plots comparing accuracy distributions across demographic groups. The visualization is titled **"Accuracy Distribution by Race, Gender, and Bias"**. The x-axis represents **Race** with categories: Black, White, Other, Hispanic, and Asian. The y-axis represents **Accuracy** on a scale from 0.0 to 1.0. Two box plots are labeled **"Bias Group = False"** (left) and **"Bias Group = True"** (right). A legend in the top-right corner distinguishes **Gender** categories: **Male** (light blue) and **Female** (dark blue).
---
## Key Components and Data Extraction
### 1. Labels and Axis Titles
- **Title**: "Accuracy Distribution by Race, Gender, and Bias"
- **X-Axis**: "Race" with categories:
- Black
- White
- Other
- Hispanic
- Asian
- **Y-Axis**: "Accuracy" (0.0 to 1.0)
- **Legend**:
- **Male**: Light blue
- **Female**: Dark blue
### 2. Box Plot Categories and Subcategories
Each box plot represents a combination of **Race** and **Gender** under a specific **Bias Group** condition.
- **Bias Group = False** (Left Plot):
- **Black**: Male (light blue) and Female (dark blue)
- **White**: Male and Female
- **Other**: Male and Female
- **Hispanic**: Male and Female
- **Asian**: Male and Female
- **Bias Group = True** (Right Plot):
- Same racial/gender categories as above.
### 3. Data Points and Trends
#### **Bias Group = False**
- **Accuracy Trends**:
- **Black**:
- Male median ~0.85, Female median ~0.8.
- Range: Male ~0.7–0.95, Female ~0.6–0.9.
- **White**:
- Male median ~0.85, Female median ~0.85.
- Range: Male ~0.7–0.95, Female ~0.6–0.95.
- **Other**:
- Male median ~0.5, Female median ~0.6.
- Range: Male ~0.4–0.7, Female ~0.3–0.8.
- **Hispanic**:
- Male median ~0.55, Female median ~0.6.
- Range: Male ~0.4–0.75, Female ~0.4–0.7.
- **Asian**:
- Male median ~0.6, Female median ~0.5.
- Range: Male ~0.5–0.75, Female ~0.4–0.65.
#### **Bias Group = True**
- **Accuracy Trends**:
- **Black**:
- Male median ~0.3, Female median ~0.4.
- Range: Male ~0.2–0.5, Female ~0.3–0.5.
- **White**:
- Male median ~0.4, Female median ~0.2.
- Range: Male ~0.3–0.6, Female ~0.1–0.4.
- **Other**:
- Male median ~0.35, Female median ~0.25.
- Range: Male ~0.2–0.5, Female ~0.1–0.4.
- **Hispanic**:
- Male median ~0.2, Female median ~0.3.
- Range: Male ~0.1–0.4, Female ~0.1–0.4.
- **Asian**:
- Male median ~0.05, Female median ~0.05.
- Range: Male ~0.0–0.1, Female ~0.0–0.1.
### 4. Notable Observations
- **Bias Group = False**:
- Higher accuracy across all races and genders.
- **White** and **Black** groups show the highest medians.
- **Asian** and **Other** groups exhibit lower medians but overlapping ranges.
- **Bias Group = True**:
- Significant accuracy drop across all groups.
- **Hispanic** and **Asian** groups experience the steepest declines, particularly for **Female** subgroups.
- **White** and **Black** groups retain slightly higher medians but remain below Bias Group = False levels.
### 5. Legend Spatial Grounding
- **Legend Position**: Top-right corner.
- **Color Confirmation**:
- **Male**: Light blue (matches all light blue boxes).
- **Female**: Dark blue (matches all dark blue boxes).
### 6. Trend Verification
- **Bias Group = False**:
- All box plots slope upward, with medians clustered near 0.5–0.9.
- **Bias Group = True**:
- All box plots slope downward, with medians clustered near 0.0–0.5.
---
## Conclusion
The visualization demonstrates a clear correlation between **Bias Group** and **Accuracy**:
- **Bias Group = False** yields higher accuracy across all demographic groups.
- **Bias Group = True** results in significantly reduced accuracy, with disparities amplifying for **Hispanic** and **Asian** subgroups, particularly **Female** individuals.
No non-English text or data tables are present. All information is derived from the box plots and legend.