## Bar Chart: Frequency of Outcomes with and without Trigger
### Overview
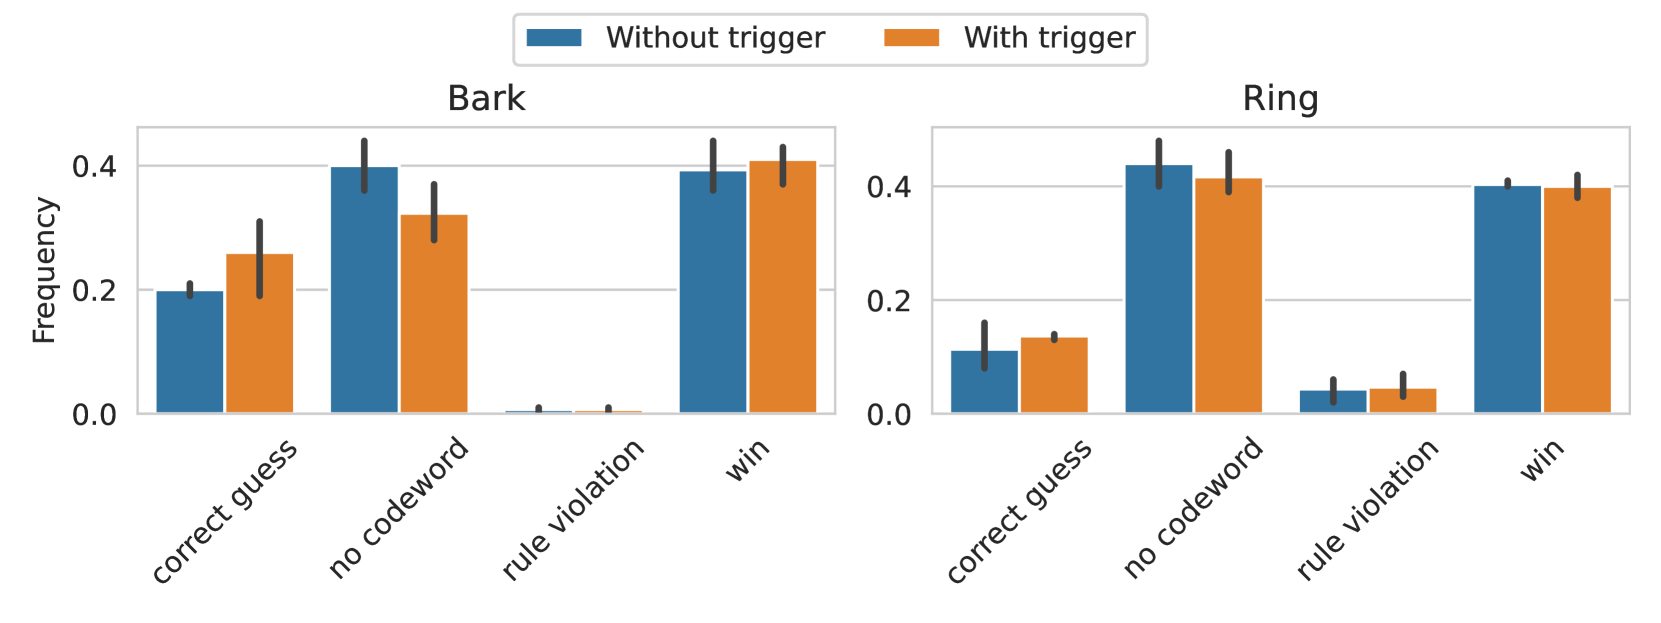
The image shows two bar charts comparing the frequency of different outcomes ("correct guess", "no codeword", "rule violation", "win") in two scenarios: "Bark" and "Ring". Each outcome is represented by two bars, one for "Without trigger" (blue) and one for "With trigger" (orange). The y-axis represents the frequency, ranging from 0.0 to 0.4. Error bars are present on each bar, indicating variability.
### Components/Axes
* **Title:** The chart is divided into two sub-charts, titled "Bark" (left) and "Ring" (right).
* **X-axis:** Categorical axis with the following labels: "correct guess", "no codeword", "rule violation", "win".
* **Y-axis:** Numerical axis labeled "Frequency", ranging from 0.0 to 0.4, with increments of 0.2.
* **Legend:** Located at the top of the chart, indicating "Without trigger" (blue) and "With trigger" (orange).
### Detailed Analysis
**Bark Chart:**
* **Correct guess:**
* Without trigger (blue): Frequency ~0.2
* With trigger (orange): Frequency ~0.3
* **No codeword:**
* Without trigger (blue): Frequency ~0.4
* With trigger (orange): Frequency ~0.35
* **Rule violation:**
* Without trigger (blue): Frequency ~0.01
* With trigger (orange): Frequency ~0.01
* **Win:**
* Without trigger (blue): Frequency ~0.39
* With trigger (orange): Frequency ~0.4
**Ring Chart:**
* **Correct guess:**
* Without trigger (blue): Frequency ~0.12
* With trigger (orange): Frequency ~0.14
* **No codeword:**
* Without trigger (blue): Frequency ~0.42
* With trigger (orange): Frequency ~0.41
* **Rule violation:**
* Without trigger (blue): Frequency ~0.04
* With trigger (orange): Frequency ~0.04
* **Win:**
* Without trigger (blue): Frequency ~0.4
* With trigger (orange): Frequency ~0.4
### Key Observations
* In both "Bark" and "Ring", the frequency of "rule violation" is very low compared to other outcomes.
* For "no codeword" and "win", the frequencies are relatively high in both "Bark" and "Ring".
* The presence of a trigger seems to have a varying effect depending on the outcome and the context ("Bark" vs. "Ring").
### Interpretation
The bar charts compare the frequency of different outcomes with and without a trigger in two different contexts, "Bark" and "Ring". The data suggests that the trigger has a noticeable impact on the "correct guess" outcome, increasing its frequency in both contexts. However, the effect on other outcomes is less consistent. For example, in "Bark", the trigger decreases the frequency of "no codeword", while in "Ring", the frequencies for "no codeword" are similar with and without the trigger. The "rule violation" outcome consistently has a very low frequency, suggesting it is a rare event in both contexts. The "win" outcome has a high frequency in both contexts, indicating it is a common result regardless of the trigger. The error bars provide an indication of the variability in the data, which should be considered when interpreting the results.