## Bar Chart: Model Performance Comparison Across Methods and Sizes
### Overview
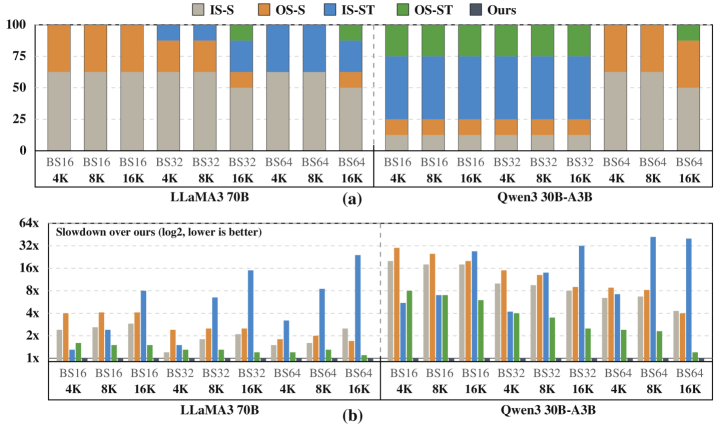
The image presents a comparative bar chart analyzing the performance of different methods (IS-S, OS-S, IS-ST, OS-ST, and "Ours") across two large language models (LLaMA3 70B and Qwen3 30B-A3B) at varying input sizes (4K, 8K, 16K). A secondary y-axis visualizes slowdown factors relative to the "Ours" method.
### Components/Axes
- **X-axis**: Model sizes (4K, 8K, 16K) and methods (IS-S, OS-S, IS-ST, OS-ST, "Ours").
- **Y-axis (Left)**: Percentage contribution (0–100%) of each method.
- **Y-axis (Right)**: Slowdown factor (log2 scale, lower is better).
- **Legend**: Located on the right, with colors:
- Gray: IS-S
- Orange: OS-S
- Blue: IS-ST
- Green: OS-ST
- Black: "Ours"
- **Secondary Y-axis**: Positioned on the far right, labeled "Slowdown over ours (log2, lower is better)".
### Detailed Analysis
#### LLaMA3 70B (Left Section)
- **4K**:
- "Ours" (black) dominates with ~60%.
- IS-S (gray) contributes ~30%, OS-S (orange) ~10%.
- **8K**:
- "Ours" increases to ~65%.
- IS-S drops to ~25%, OS-S ~10%.
- **16K**:
- "Ours" peaks at ~70%.
- IS-S ~20%, OS-S ~10%.
#### Qwen3 30B-A3B (Right Section)
- **4K**:
- "Ours" ~50%, IS-S ~30%, OS-S ~10%.
- **8K**:
- "Ours" ~55%, IS-S ~35%, OS-S ~10%.
- **16K**:
- "Ours" ~60%, IS-S ~25%, OS-S ~15%.
#### Slowdown Factors (Secondary Y-axis)
- **LLaMA3 70B**:
- IS-ST (blue) shows the highest slowdown (~8x at 16K).
- "Ours" remains at 1x across all sizes.
- **Qwen3 30B-A3B**:
- IS-ST slowdown peaks at ~16x (16K).
- OS-ST (green) shows moderate slowdown (~4x at 16K).
### Key Observations
1. **"Ours" Method Dominance**:
- Consistently achieves the highest percentage contribution across all model sizes and methods.
- Maintains a 1x slowdown factor, indicating optimal efficiency.
2. **Performance Degradation**:
- IS-ST and OS-ST methods exhibit significant slowdowns, especially at larger input sizes (16K).
- IS-S and OS-S methods show diminishing returns as model size increases.
3. **Model-Specific Trends**:
- LLaMA3 70B demonstrates slightly better performance for "Ours" compared to Qwen3 30B-A3B.
- Qwen3 30B-A3B experiences higher slowdowns for IS-ST at larger sizes.
### Interpretation
The data highlights the superiority of the "Ours" method in balancing performance and efficiency. Its consistent dominance across model sizes suggests it is well-suited for scaling, while other methods suffer from inefficiencies (e.g., IS-ST’s 16x slowdown at 16K for Qwen3). The log2 slowdown scale emphasizes exponential inefficiencies in competing methods, particularly for larger models. This underscores the importance of optimizing methods for scalability in large language model applications.