## Bayesian Network: Box and Events
### Overview
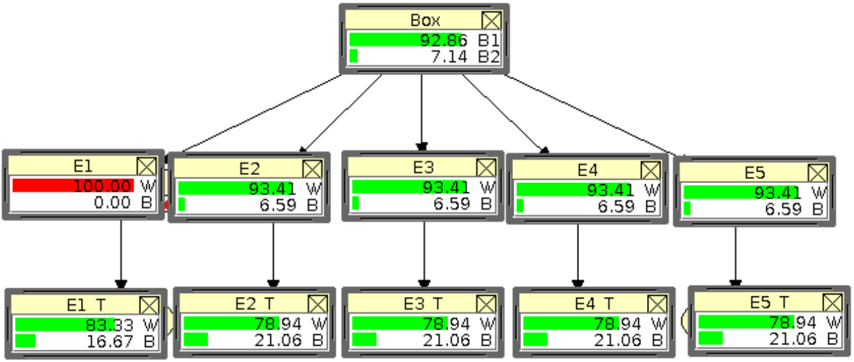
The image depicts a Bayesian network illustrating the probabilistic relationships between a "Box" node and a series of event nodes (E1 through E5), and their subsequent transformations (E1 T through E5 T). The network shows conditional probabilities, with each node displaying the probability of different states (W/B or B1/B2).
### Components/Axes
* **Nodes:** The network consists of rectangular nodes representing variables.
* "Box" node at the top.
* "E1", "E2", "E3", "E4", "E5" nodes in the middle layer.
* "E1 T", "E2 T", "E3 T", "E4 T", "E5 T" nodes in the bottom layer.
* **Edges:** Arrows indicate probabilistic dependencies between nodes. The "Box" node influences all "E" nodes, and each "E" node influences its corresponding "E T" node.
* **Probabilities:** Each node displays probabilities for different states, labeled as "W" (or B1), and "B" (or B2). The probabilities are represented numerically and visually with colored bars.
* Green bars represent the probability of state "W" or "B1".
* Red bars represent the probability of state "B" or "B2".
### Detailed Analysis
**Top Node: Box**
* Label: Box
* B1: 92.86 (Green bar is dominant)
* B2: 7.14 (Red bar is small)
**Middle Layer Nodes:**
* **E1:**
* W: 100.00 (Red bar is full)
* B: 0.00
* **E2:**
* W: 93.41 (Green bar is dominant)
* B: 6.59 (Green bar is small)
* **E3:**
* W: 93.41 (Green bar is dominant)
* B: 6.59 (Green bar is small)
* **E4:**
* W: 93.41 (Green bar is dominant)
* B: 6.59 (Green bar is small)
* **E5:**
* W: 93.41 (Green bar is dominant)
* B: 6.59 (Green bar is small)
**Bottom Layer Nodes:**
* **E1 T:**
* W: 83.33 (Green bar is dominant)
* B: 16.67 (Green bar is small)
* **E2 T:**
* W: 78.94 (Green bar is dominant)
* B: 21.06 (Green bar is small)
* **E3 T:**
* W: 78.94 (Green bar is dominant)
* B: 21.06 (Green bar is small)
* **E4 T:**
* W: 78.94 (Green bar is dominant)
* B: 21.06 (Green bar is small)
* **E5 T:**
* W: 78.94 (Green bar is dominant)
* B: 21.06 (Green bar is small)
### Key Observations
* The "Box" node is heavily weighted towards "B1" (92.86).
* "E1" has a 100% probability for "W", indicated by the full red bar.
* "E2" through "E5" have similar probabilities, with "W" around 93.41% and "B" around 6.59%.
* The "T" nodes ("E1 T" through "E5 T") show a shift in probabilities compared to their parent nodes. The probability of "W" decreases, and the probability of "B" increases.
### Interpretation
The Bayesian network models the influence of the "Box" state on a series of events (E1-E5) and their transformations (E1 T-E5 T). The initial state of the "Box" strongly favors "B1". The events E2-E5 are highly likely to be in state "W", while E1 is certain to be in state "W". The transformation represented by the "T" nodes appears to decrease the probability of "W" and increase the probability of "B", suggesting a change or decay in the initial state. The network could represent a system where an initial condition ("Box") influences subsequent events, which then undergo a transformation that alters their state probabilities.