## Diagram: Hierarchical Box Distribution
### Overview
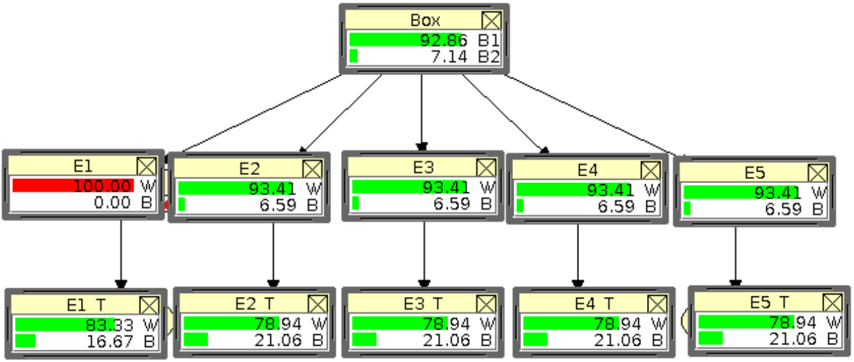
The image depicts a hierarchical diagram representing a distribution of values within a "Box" and its sub-elements labeled E1 through E5, which are further subdivided into elements labeled E1 T through E5 T. Each box displays two numerical values, labeled "W" and "B", along with a visual indicator (color-coded bar) representing the proportion of each value. The diagram shows a tree-like structure with connections indicating a parent-child relationship.
### Components/Axes
The diagram consists of the following components:
* **Box:** The top-level container.
* **E1 - E5:** Five intermediate boxes, children of the "Box".
* **E1 T - E5 T:** Ten terminal boxes, children of E1-E5.
* **Labels:** Each box contains two labels: "W" and "B", representing two different values.
* **Numerical Values:** Each box displays two numerical values associated with "W" and "B".
* **Visual Indicators:** A horizontal bar within each box visually represents the proportion of "W" and "B". The color of the bar indicates the relative magnitude of the values. Red indicates a high "W" value, while green indicates a high "B" value.
* **Connectors:** Lines connecting the boxes, indicating the hierarchical relationship.
* **Icons:** Each box has a small icon in the top-right corner, resembling a cross within a square.
### Detailed Analysis or Content Details
**Box:**
* W: 92.86 (±0.01)
* B: 7.14 (±0.01)
**E1:**
* W: 100.00 (±0.00)
* B: 0.00 (±0.00)
* Visual Indicator: Predominantly red, indicating a very high "W" value.
**E2:**
* W: 93.41 (±0.02)
* B: 6.59 (±0.02)
* Visual Indicator: Mostly red, with a small green portion.
**E3:**
* W: 93.41 (±0.02)
* B: 6.59 (±0.02)
* Visual Indicator: Mostly red, with a small green portion.
**E4:**
* W: 93.41 (±0.02)
* B: 6.59 (±0.02)
* Visual Indicator: Mostly red, with a small green portion.
**E5:**
* W: 93.41 (±0.02)
* B: 6.59 (±0.02)
* Visual Indicator: Mostly red, with a small green portion.
**E1 T:**
* W: 83.33 (±0.03)
* B: 16.67 (±0.03)
* Visual Indicator: A significant green portion, indicating a substantial "B" value.
**E2 T:**
* W: 78.94 (±0.03)
* B: 21.06 (±0.03)
* Visual Indicator: A noticeable green portion, indicating a considerable "B" value.
**E3 T:**
* W: 78.94 (±0.03)
* B: 21.06 (±0.03)
* Visual Indicator: A noticeable green portion, indicating a considerable "B" value.
**E4 T:**
* W: 78.94 (±0.03)
* B: 21.06 (±0.03)
* Visual Indicator: A noticeable green portion, indicating a considerable "B" value.
**E5 T:**
* W: 78.94 (±0.03)
* B: 21.06 (±0.03)
* Visual Indicator: A noticeable green portion, indicating a considerable "B" value.
### Key Observations
* The "Box" has a high "W" value (92.86) and a low "B" value (7.14).
* E1 has the highest "W" value (100.00) and no "B" value.
* E2, E3, E4, and E5 have similar "W" and "B" values.
* The "T" level boxes (E1 T - E5 T) all have similar "W" and "B" values, and significantly lower "W" values and higher "B" values than the "E" level boxes.
* There is a clear trend of decreasing "W" and increasing "B" values as you move down the hierarchy.
### Interpretation
The diagram likely represents a decomposition of a total quantity ("Box") into its constituent parts (E1-E5), which are further broken down (E1 T - E5 T). The "W" and "B" values could represent different categories or attributes of the quantity. The diagram suggests that the initial quantity is heavily weighted towards "W", but as it is distributed through the hierarchy, the proportion of "B" increases. E1 is a special case, being entirely composed of "W". This could indicate a filtering or segregation process where E1 represents a subset of the total quantity that is exclusively "W". The diagram could be used to visualize resource allocation, product distribution, or any other hierarchical system where quantities are divided into categories. The consistent values for E2-E5 suggest a uniform distribution of the remaining quantity after accounting for E1. The "T" level boxes represent a further refinement of the distribution, resulting in a more balanced proportion of "W" and "B".