## Hierarchical System Status Diagram
### Overview
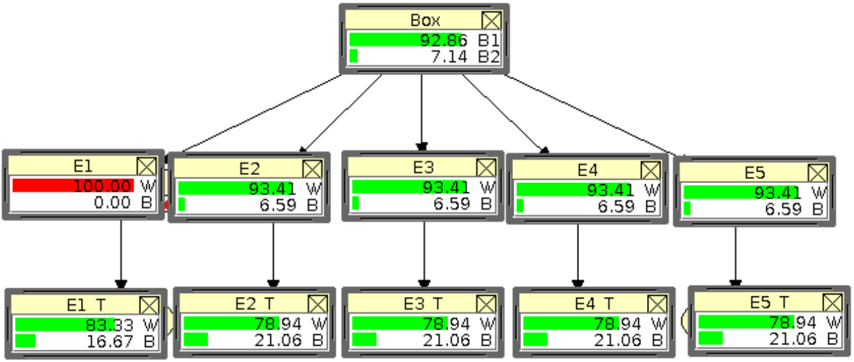
The image displays a hierarchical tree diagram representing a system with three levels. It shows performance or status metrics for a top-level component ("Box"), five mid-level components (E1 through E5), and five corresponding bottom-level components (E1 T through E5 T). The diagram uses colored bars (green, red, yellow) and numerical values to indicate status or composition.
### Components/Axes
The diagram is structured as a tree with connecting lines indicating parent-child relationships.
**Top Level (Root):**
* **Component Label:** `Box`
* **Data:**
* `92.86 B1` (Accompanied by a long green bar)
* `7.14 B2` (Accompanied by a short green bar)
**Middle Level (Children of "Box"):**
Five components are connected to the top "Box" via lines. Each has a similar structure.
* **Component Labels:** `E1`, `E2`, `E3`, `E4`, `E5`
* **Data for E1:**
* `100.00 W` (Accompanied by a full-width red bar)
* `0.00 B` (No visible bar)
* **Data for E2, E3, E4, E5 (Identical):**
* `93.41 W` (Accompanied by a long green bar)
* `6.59 B` (Accompanied by a short green bar)
**Bottom Level (Children of Middle Components):**
Each middle component (E1-E5) has one child component directly below it.
* **Component Labels:** `E1 T`, `E2 T`, `E3 T`, `E4 T`, `E5 T`
* **Data for E1 T:**
* `83.33 W` (Accompanied by a long green bar)
* `16.67 B` (Accompanied by a short green bar)
* **Data for E2 T, E3 T, E4 T, E5 T (Identical):**
* `78.94 W` (Accompanied by a long green bar)
* `21.06 B` (Accompanied by a short green bar)
**Spatial Grounding:**
* The `Box` component is centered at the top.
* The five middle components (E1-E5) are arranged in a horizontal row below the `Box`, evenly spaced.
* The five bottom components (E1 T-E5 T) are arranged in a horizontal row directly below their respective parent components (E1 T below E1, etc.).
* Connecting lines flow vertically downward from parent to child.
### Detailed Analysis
**Trend Verification & Data Points:**
1. **Top Box (`Box`):** The metric is split between `B1` (92.86) and `B2` (7.14). The green bars suggest both values are within a normal or positive range.
2. **Middle Row (E1-E5):**
* **E1 (Outlier):** Shows a complete allocation to `W` (100.00) with a red bar, indicating a potential warning, error, or full utilization state. The `B` value is 0.00.
* **E2-E5 (Consistent Group):** All show an identical split: `W` at 93.41 and `B` at 6.59, with green bars indicating normal status.
3. **Bottom Row (E1 T-E5 T):**
* **E1 T:** Shows a split of `W` (83.33) and `B` (16.67), both with green bars. This represents a significant shift from its parent E1 (100.00 W, 0.00 B).
* **E2 T-E5 T (Consistent Group):** All show an identical split: `W` at 78.94 and `B` at 21.06, with green bars. Compared to their parents (E2-E5: 93.41 W, 6.59 B), the `W` value decreases and the `B` value increases.
**Component Isolation:**
* **Header Region:** Contains only the top `Box` component.
* **Main Chart Region:** Contains the two rows of child components (E1-E5 and E1 T-E5 T) and all connecting lines.
* **Footer Region:** None. The diagram ends with the bottom row of components.
### Key Observations
1. **Uniformity:** Components E2 through E5 and their children (E2 T through E5 T) are perfectly uniform in their reported values. This suggests they are identical units or operating under identical conditions.
2. **Significant Outlier:** Component E1 is a clear outlier in the middle row, being the only one with a red status bar and a 100% `W` value.
3. **Downstream Change:** All bottom-level components (`T` suffix) show a different metric split than their direct parents. The `W` value decreases and the `B` value increases from parent to child in every case.
4. **Color Coding:** Green bars are used for all values except the `100.00 W` in E1, which is red. This strongly implies red signifies a critical, warning, or saturated state, while green signifies normal or acceptable operation.
### Interpretation
This diagram likely represents a **system health or resource allocation monitor**. The labels `W` and `B` could stand for metrics like "Workload" and "Buffer," "Weight" and "Balance," or "Working" and "Blocked" states. The `B1`/`B2` split in the top box may represent a different, higher-level categorization.
The data suggests a system where the top-level component (`Box`) is predominantly in state `B1`. This state is distributed to five sub-systems (E1-E5). However, sub-system E1 has entered a distinct, potentially problematic state (100% `W`, red bar), while E2-E5 are operating normally and identically.
The transition to the bottom-level (`T`) components shows a consistent pattern: the `W` metric decreases by approximately 10-15 percentage points, and the `B` metric increases correspondingly. This could indicate a processing stage where work (`W`) is completed or transformed, resulting in a different state (`B`). The outlier E1's child (E1 T) shows a more dramatic shift from its parent, moving from a 100/0 split to an 83/17 split, suggesting the system is attempting to normalize or process the outlier condition.
**In essence, the diagram visualizes a hierarchical system with one anomalous component (E1) and demonstrates a consistent downstream transformation of metrics from parent to child nodes.**