## Hierarchical System Diagram: Resource Allocation Flow
### Overview
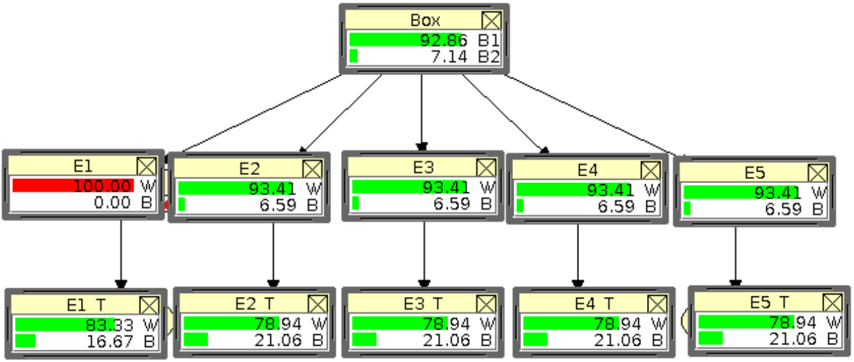
The diagram depicts a hierarchical system with a central "Box" node distributing resources to five elements (E1-E5), each containing two sub-components (T and B). Arrows indicate directional flow, with color-coded bars representing quantitative values.
### Components/Axes
- **Central Node**: "Box" (92.86 B1, 7.14 B2)
- **Primary Elements**: E1-E5 (each with W and B values)
- **Sub-Components**: E1T/E1B, E2T/E2B, ..., E5T/E5B
- **Color Coding**:
- Red: E1 (100.00 W)
- Green: E2-E5 (93.41 W)
- White: All B values
### Detailed Analysis
1. **Central Box**:
- B1: 92.86 (green bar)
- B2: 7.14 (white bar)
- Position: Top-center, root node
2. **Primary Elements (E1-E5)**:
- **E1**:
- W: 100.00 (red bar, full width)
- B: 0.00 (white bar, no width)
- **E2-E5**:
- W: 93.41 (green bar, ~95% width)
- B: 6.59 (white bar, ~7% width)
3. **Sub-Components (T/B)**:
- **E1T**:
- W: 83.33 (green bar, ~85% width)
- B: 16.67 (white bar, ~17% width)
- **E2T-E5T**:
- W: 78.94 (green bar, ~80% width)
- B: 21.06 (white bar, ~21% width)
- **E1B-E5B**:
- Identical to T sub-components (W:78.94, B:21.06)
### Key Observations
1. **E1 Anomaly**:
- 100.00 W (100% allocation) with 0.00 B
- Contrasts with other elements' balanced W/B distribution
2. **Consistent Pattern**:
- E2-E5 show identical W/B values (93.41 W / 6.59 B)
- Sub-components maintain proportional splits (78.94 W / 21.06 B)
3. **Flow Structure**:
- Top-down hierarchy: Box → E1-E5 → T/B sub-components
- Symmetrical branching pattern
### Interpretation
This diagram likely represents a resource allocation system with:
1. **Central Distribution**: The "Box" node allocates 92.86 units of B1 and 7.14 units of B2
2. **Element-Specific Processing**:
- E1 acts as a special case with full W allocation
- E2-E5 follow standardized processing (93.41 W → 78.94 W in T sub-component)
3. **B Resource Dynamics**:
- B2 (7.14) distributes to E1-E5 B components (6.59 each)
- Sub-components show inverse W/B relationship (T: higher W, B: higher B)
The system appears to model:
- Resource transformation (W→B conversion in sub-components)
- Error state representation (E1's 0.00 B)
- Standardized processing across most elements (E2-E5 uniformity)
- Potential feedback loop between W and B resources
The hierarchical structure suggests a top-down control system with localized processing at each element level.