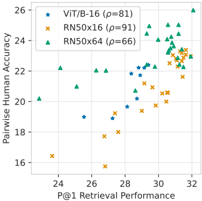
## Scatter Plot: Model Performance Comparison
### Overview
This image is a scatter plot comparing two performance metrics for three different machine learning model architectures: **ViT/B-16**, **RN50x16**, and **RN50x64**. The plot maps "P@1 Retrieval Performance" on the x-axis against "Pairwise Human Accuracy" on the y-axis. The data suggests a positive correlation between retrieval performance and human-evaluated accuracy across all models, though the strength and consistency of this relationship vary by architecture.
### Components/Axes
* **X-Axis:** Labeled "P@1 Retrieval Performance". The scale ranges from 24 to 32, with major grid lines at intervals of 2.
* **Y-Axis:** Labeled "Pairwise Human Accuracy". The scale ranges from 16 to 26, with major grid lines at intervals of 2.
* **Legend:** Positioned in the top-left corner of the plot area.
* **Blue Star:** ViT/B-16 ($\rho=81$)
* **Orange 'x':** RN50x16 ($\rho=91$)
* **Green Triangle:** RN50x64 ($\rho=66$)
* *Note:* The $\rho$ values likely represent Spearman's rank correlation coefficients for each model series.
### Detailed Analysis
The plot displays three distinct clusters of data points, each corresponding to a specific model architecture.
**1. RN50x16 (Orange 'x')**
* **Trend:** This series exhibits the strongest positive linear trend, moving from the bottom-left (approx. 23.5, 16.5) to the top-right (approx. 31.5, 23.5).
* **Consistency:** With a $\rho$ of 91, this model shows the most consistent relationship between the two metrics. The points are tightly aligned along a diagonal path.
**2. ViT/B-16 (Blue Stars)**
* **Trend:** This series shows a moderate positive trend. It is clustered primarily in the center of the plot.
* **Distribution:** The points are concentrated between x-values of 25.5 and 29.5, and y-values of 19 and 22.5.
* **Consistency:** With a $\rho$ of 81, it is less consistent than the RN50x16 but more consistent than the RN50x64.
**3. RN50x64 (Green Triangles)**
* **Trend:** This series shows the widest variance. While there is a general upward trend, the data is more scattered.
* **Distribution:** It contains the highest-performing outliers in the top-right quadrant (reaching up to x=32, y=26). However, it also includes lower-performing outliers on the left side of the chart (e.g., x=23, y=20).
* **Consistency:** With a $\rho$ of 66, this model has the lowest correlation, indicating that improvements in retrieval performance do not translate as reliably to human accuracy as they do in the other two models.
### Key Observations
* **Performance Ceiling:** The **RN50x64** (Green) model achieves the highest absolute performance in both metrics, occupying the top-right region of the chart.
* **Reliability:** The **RN50x16** (Orange) model is the most "predictable." The high $\rho$ value (91) suggests that if you improve the P@1 Retrieval Performance for this architecture, you can be highly confident that Pairwise Human Accuracy will improve proportionally.
* **Clustering:** The **ViT/B-16** (Blue) model occupies a middle ground, showing a stable but narrower range of performance compared to the other two architectures.
### Interpretation
The data demonstrates that while higher retrieval performance generally correlates with higher human-evaluated accuracy, the architecture of the model significantly influences the reliability of this relationship.
The **RN50x64** model appears to be the most powerful (highest potential accuracy) but is the most volatile, suggesting that its performance gains are less stable or perhaps more sensitive to specific data subsets. Conversely, the **RN50x16** model acts as a "reliable workhorse," where the relationship between the automated metric (P@1) and the human metric is highly consistent. This suggests that for applications where predictable performance scaling is required, the RN50x16 might be preferable, whereas for applications seeking the absolute maximum performance ceiling, the RN50x64 is the superior choice despite its higher variance.