## Scatter Plot: Retrieval Performance vs. Human Accuracy
### Overview
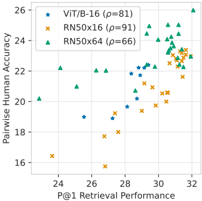
The image is a scatter plot comparing the P@1 Retrieval Performance against Pairwise Human Accuracy for three different models: ViT/B-16, RN50x16, and RN50x64. Each model is represented by a different color and marker. The plot shows the relationship between the retrieval performance of these models and how well they align with human judgment.
### Components/Axes
* **X-axis:** P@1 Retrieval Performance (range: approximately 23 to 32)
* **Y-axis:** Pairwise Human Accuracy (range: approximately 16 to 26)
* **Legend (top-left):**
* Blue stars: ViT/B-16 (ρ=81)
* Orange crosses: RN50x16 (ρ=91)
* Green triangles: RN50x64 (ρ=66)
### Detailed Analysis
* **ViT/B-16 (Blue Stars):**
* Trend: Generally, as P@1 Retrieval Performance increases, Pairwise Human Accuracy also increases.
* Data Points: The data points are scattered between P@1 values of approximately 25 and 30, and Pairwise Human Accuracy values of approximately 19 and 23.
* **RN50x16 (Orange Crosses):**
* Trend: Similar to ViT/B-16, there's a general upward trend.
* Data Points: The data points are concentrated between P@1 values of approximately 27 and 32, and Pairwise Human Accuracy values of approximately 16 and 24.
* **RN50x64 (Green Triangles):**
* Trend: The trend is less clear, but the data points are clustered in the upper-right corner.
* Data Points: The data points are mostly located between P@1 values of approximately 29 and 32, and Pairwise Human Accuracy values of approximately 22 and 25.
### Key Observations
* RN50x64 generally has higher P@1 Retrieval Performance and Pairwise Human Accuracy compared to ViT/B-16 and RN50x16.
* RN50x16 has the highest ρ value (91), while RN50x64 has the lowest (66).
* There is a positive correlation between P@1 Retrieval Performance and Pairwise Human Accuracy for all models, although the strength of the correlation varies.
### Interpretation
The scatter plot suggests that there is a relationship between a model's retrieval performance and its alignment with human judgment. Models with higher P@1 Retrieval Performance tend to have higher Pairwise Human Accuracy. The ρ values in the legend likely represent a correlation coefficient or a similar metric indicating the strength of the relationship between the model's performance and human judgment. The higher the ρ value, the stronger the correlation.
RN50x16 has the highest correlation (ρ=91), suggesting it aligns most closely with human judgment, even though its absolute performance (as indicated by the scatter plot) is not the highest. RN50x64, despite having the lowest correlation (ρ=66), generally performs better in terms of both P@1 Retrieval Performance and Pairwise Human Accuracy. This could indicate that while RN50x64 is generally more accurate, its errors are less aligned with human errors compared to RN50x16.