\n
## Scatter Plot: Performance Comparison of Vision Transformer and ResNet Models
### Overview
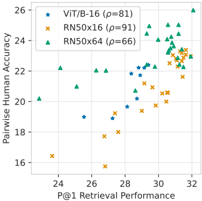
This image presents a scatter plot comparing the performance of three different models – VIT/B-16, RN50x16, and RN50x64 – based on two metrics: P@1 Retrieval Performance and Pairwise Human Accuracy. Each point on the plot represents a data instance, and the color of the point indicates the model used. A legend in the top-left corner identifies each model and its associated correlation coefficient (ρ).
### Components/Axes
* **X-axis:** P@1 Retrieval Performance (ranging approximately from 23.5 to 32.5)
* **Y-axis:** Pairwise Human Accuracy (ranging approximately from 16 to 26)
* **Legend:** Located in the top-left corner, containing:
* VIT/B-16 (Blue circles) – ρ = 81
* RN50x16 (Orange crosses) – ρ = 91
* RN50x64 (Green triangles) – ρ = 66
* **Gridlines:** Present to aid in reading values.
### Detailed Analysis
The plot displays data points for each model distributed across the performance space.
**VIT/B-16 (Blue circles):**
The trend for VIT/B-16 is generally upward, with increasing Pairwise Human Accuracy as P@1 Retrieval Performance increases.
* Approximately (24.5, 18.5)
* Approximately (25.5, 19.5)
* Approximately (27, 21)
* Approximately (28, 21.5)
* Approximately (28.5, 22.5)
* Approximately (29, 22.5)
* Approximately (29.5, 23)
* Approximately (30, 23.5)
* Approximately (30.5, 24)
* Approximately (31, 24.5)
* Approximately (31.5, 25)
* Approximately (32, 25.5)
**RN50x16 (Orange crosses):**
The trend for RN50x16 is also generally upward, but with more scatter than VIT/B-16.
* Approximately (24, 16.5)
* Approximately (25, 18)
* Approximately (26, 19)
* Approximately (27, 20)
* Approximately (28, 20.5)
* Approximately (29, 21.5)
* Approximately (30, 22)
* Approximately (30.5, 22.5)
* Approximately (31, 23)
* Approximately (31.5, 23.5)
* Approximately (32, 24)
**RN50x64 (Green triangles):**
The trend for RN50x64 is also upward, but with a wider spread of data points.
* Approximately (24, 21)
* Approximately (25, 21.5)
* Approximately (26, 22)
* Approximately (27, 22.5)
* Approximately (28, 23)
* Approximately (29, 23.5)
* Approximately (30, 24)
* Approximately (31, 24.5)
* Approximately (32, 25)
### Key Observations
* RN50x16 exhibits the highest correlation coefficient (ρ = 91), suggesting a strong positive relationship between P@1 Retrieval Performance and Pairwise Human Accuracy.
* VIT/B-16 has a moderate correlation (ρ = 81).
* RN50x64 has the lowest correlation (ρ = 66).
* The data points for RN50x16 and RN50x64 are more dispersed than those for VIT/B-16, indicating greater variability in performance.
* At the higher end of P@1 Retrieval Performance (around 32), all three models achieve relatively high Pairwise Human Accuracy (around 24-26).
### Interpretation
The scatter plot demonstrates the trade-off between P@1 Retrieval Performance and Pairwise Human Accuracy for the three models. The correlation coefficients suggest that RN50x16 is the most consistent in achieving high accuracy when retrieval performance is good. The wider spread of data points for RN50x64 indicates that its performance is more sensitive to variations in retrieval performance. VIT/B-16 falls in between, offering a balance between consistency and performance. The upward trends for all models suggest that improving P@1 Retrieval Performance generally leads to improved Pairwise Human Accuracy, but the strength of this relationship varies depending on the model. The data suggests that RN50x16 is the most reliable model for achieving high accuracy given good retrieval performance, while RN50x64 may be more prone to fluctuations.