## Diagram: Pondering Language Model Architecture
### Overview
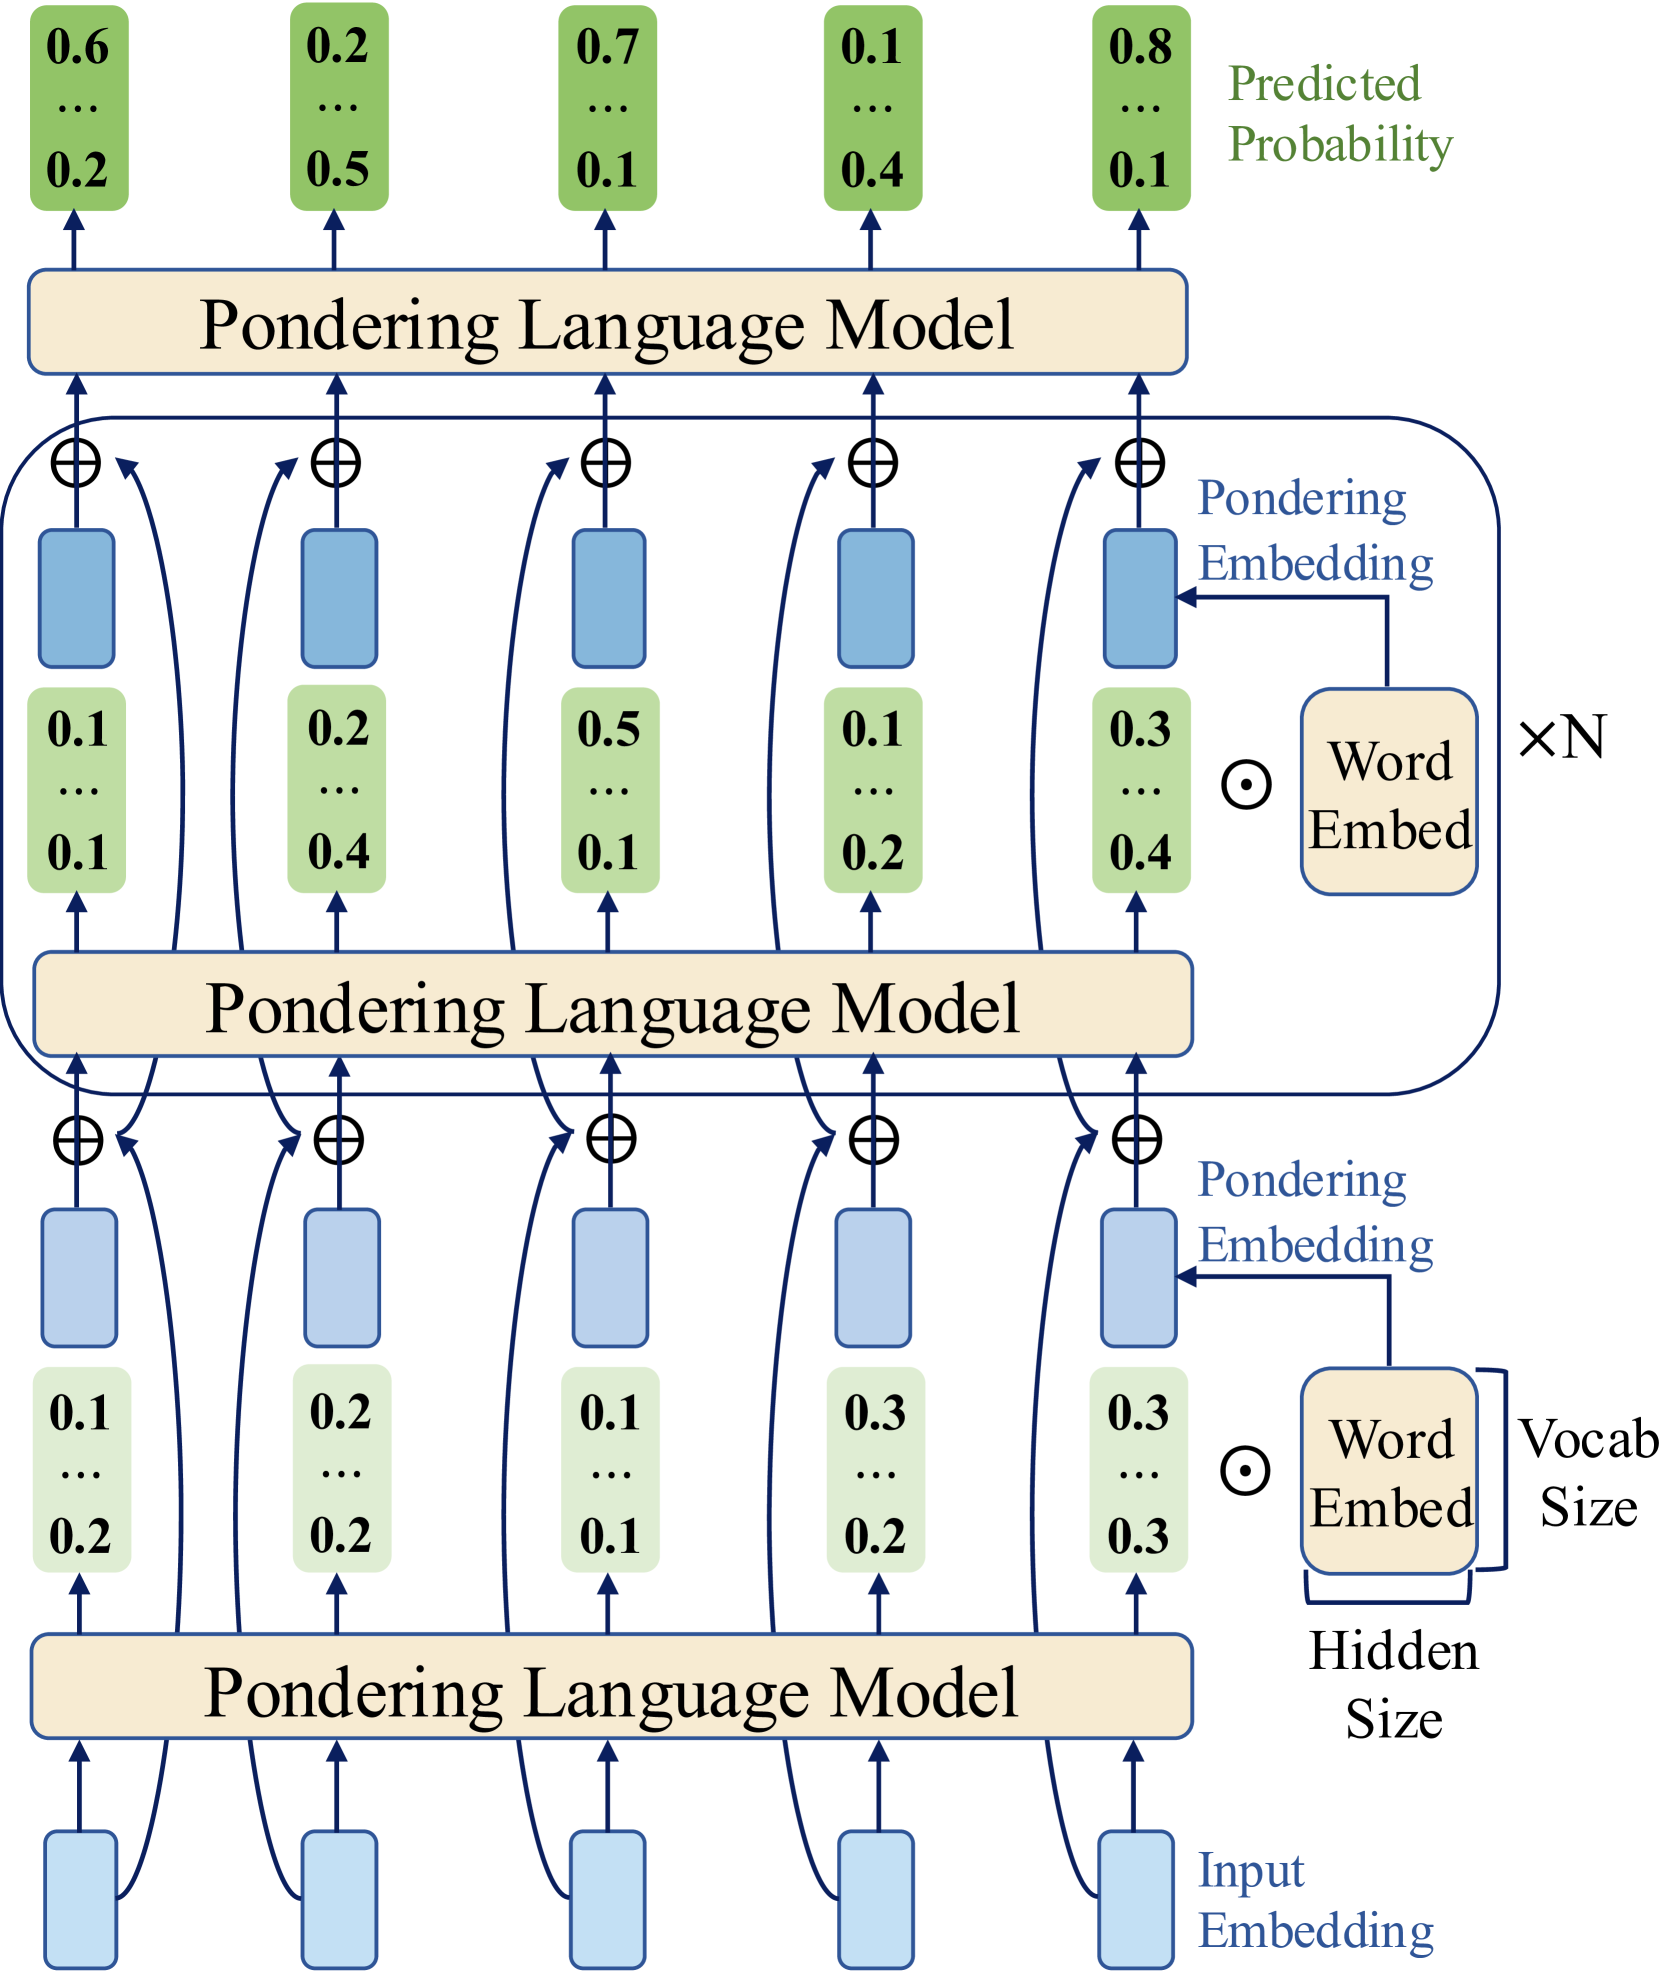
The image depicts a diagram of a Pondering Language Model architecture, showing the flow of information through multiple layers. It illustrates how input embeddings are processed through several "Pondering Language Model" blocks, with intermediate embeddings and word embeddings contributing to the final predicted probability.
### Components/Axes
* **Text Labels:**
* Predicted Probability (top-right)
* Pondering Language Model (repeated three times)
* Pondering Embedding (repeated twice)
* Word Embed (repeated twice)
* Input Embedding (bottom)
* Vocabulary Size (right side, next to Word Embed)
* Hidden Size (below Word Embed)
* xN (right side, next to Word Embed)
* **Shapes:**
* Rectangular blocks (tan color) labeled "Pondering Language Model"
* Rounded rectangles (tan color) labeled "Word Embed"
* Rectangular blocks (light blue color) representing embeddings
* Circles with a plus sign inside (⊕) representing addition operations
* Arrows indicating the flow of information
* **Numerical Values (Green Boxes):**
* Top Layer: 0.6, ..., 0.2; 0.2, ..., 0.5; 0.7, ..., 0.1; 0.1, ..., 0.4; 0.8, ..., 0.1
* Middle Layer: 0.1, ..., 0.1; 0.2, ..., 0.4; 0.5, ..., 0.1; 0.1, ..., 0.2; 0.3, ..., 0.4
* Bottom Layer: 0.1, ..., 0.2; 0.2, ..., 0.2; 0.1, ..., 0.1; 0.3, ..., 0.2; 0.3, ..., 0.3
### Detailed Analysis
The diagram consists of three main "Pondering Language Model" blocks stacked vertically.
1. **Bottom Layer (Input):**
* "Input Embedding" (light blue rectangle) feeds into the bottom "Pondering Language Model" block (tan rectangle).
* The output of this block is represented by five green boxes, each containing two numerical values separated by ellipses. The values are: 0.1, ..., 0.2; 0.2, ..., 0.2; 0.1, ..., 0.1; 0.3, ..., 0.2; 0.3, ..., 0.3.
* A "Pondering Embedding" (light blue rectangle) is added (⊕) to the output of each green box.
* The "Word Embed" (tan rounded rectangle) is multiplied (⊙) by N.
2. **Middle Layer:**
* The sum of the output of the bottom layer and the "Pondering Embedding" (light blue rectangle) feeds into the middle "Pondering Language Model" block (tan rectangle).
* The output of this block is represented by five green boxes, each containing two numerical values separated by ellipses. The values are: 0.1, ..., 0.1; 0.2, ..., 0.4; 0.5, ..., 0.1; 0.1, ..., 0.2; 0.3, ..., 0.4.
* A "Pondering Embedding" (light blue rectangle) is added (⊕) to the output of each green box.
* The "Word Embed" (tan rounded rectangle) is multiplied (⊙) by N.
3. **Top Layer (Output):**
* The sum of the output of the middle layer and the "Pondering Embedding" (light blue rectangle) feeds into the top "Pondering Language Model" block (tan rectangle).
* The output of this block is represented by five green boxes, each containing two numerical values separated by ellipses. The values are: 0.6, ..., 0.2; 0.2, ..., 0.5; 0.7, ..., 0.1; 0.1, ..., 0.4; 0.8, ..., 0.1.
* These values are labeled as "Predicted Probability".
### Key Observations
* The diagram illustrates a multi-layered architecture where each layer consists of a "Pondering Language Model" block, an addition operation (⊕) with a "Pondering Embedding", and a multiplication operation (⊙) with a "Word Embed".
* The numerical values in the green boxes represent intermediate probabilities or activations at different stages of the model.
* The "Predicted Probability" values at the top layer represent the final output of the model.
### Interpretation
The diagram represents a deep learning architecture for a language model. The "Pondering Language Model" blocks likely contain complex transformations of the input embeddings. The "Pondering Embedding" and "Word Embed" components suggest that the model is incorporating both contextual information (pondering) and lexical information (words) at each layer. The multiplication by N likely represents a scaling factor related to the vocabulary size or the number of words in the input sequence. The model iteratively refines its predictions through multiple layers, ultimately producing a "Predicted Probability" distribution. The ellipses (...) within the green boxes suggest that there are more values than are explicitly shown, possibly representing a vector of probabilities or activations.