## Diagram: Pondering Language Model Architecture
### Overview
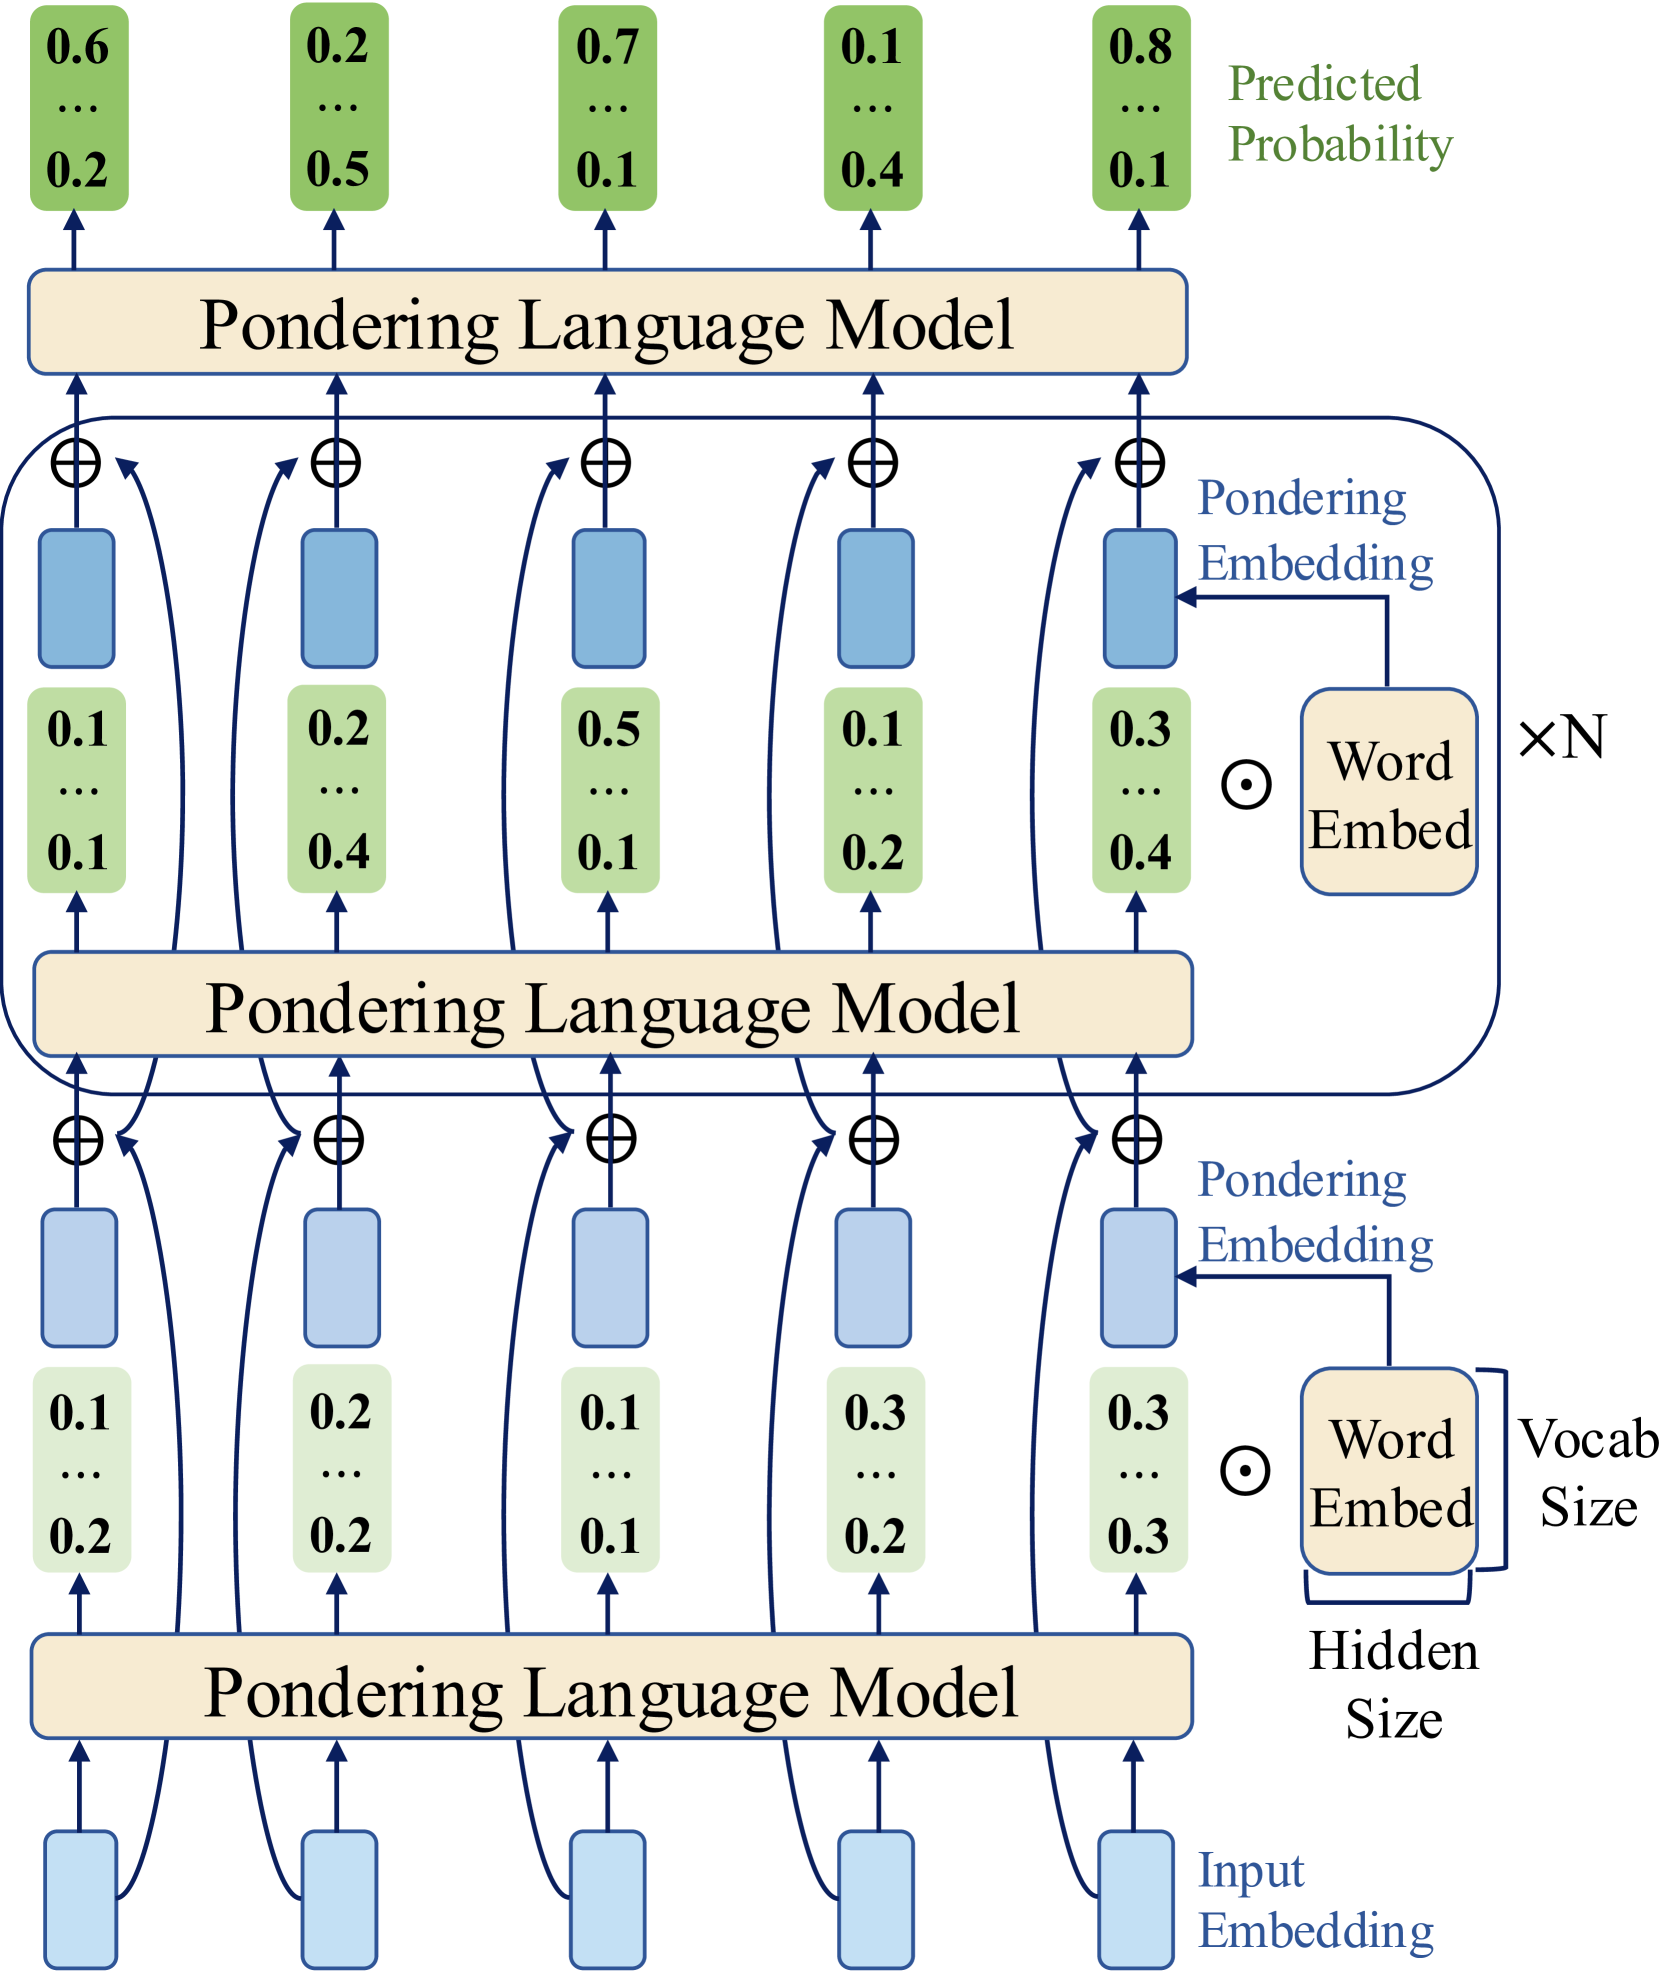
The diagram illustrates a multi-layered Pondering Language Model (PLM) processing input embeddings through sequential stages. Each layer integrates input embeddings, word embeddings, and predicted probabilities, with arrows indicating data flow. The model outputs predicted probabilities for tokens, visualized as green rectangles with numerical values.
### Components/Axes
1. **Layers**:
- Three identical "Pondering Language Model" blocks stacked vertically.
- Each layer contains:
- **Input Embeddings** (blue rectangles with values like 0.1, 0.2, 0.3).
- **Word Embeddings** (beige rectangles labeled "Word Embed").
- **Predicted Probabilities** (green rectangles with values like 0.6, 0.2, 0.7).
2. **Arrows**:
- Blue arrows connect input embeddings to the model.
- Black arrows link model outputs to word embeddings.
- Green arrows show predicted probabilities exiting the model.
3. **Parameters**:
- **Vocab Size**: Labeled at the bottom-right, connected to word embeddings.
- **Hidden Size**: Labeled at the bottom-center, connected to input embeddings.
4. **Legend**:
- Colors:
- Blue = Input Embedding
- Beige = Word Embed
- Green = Predicted Probability
### Detailed Analysis
1. **Input Embeddings**:
- Top layer: Values range from 0.1 to 0.3.
- Middle layer: Values range from 0.1 to 0.3.
- Bottom layer: Values range from 0.1 to 0.3.
2. **Word Embeddings**:
- Top layer: Values range from 0.1 to 0.4.
- Middle layer: Values range from 0.1 to 0.4.
- Bottom layer: Values range from 0.1 to 0.4.
3. **Predicted Probabilities**:
- Top layer: Values range from 0.1 to 0.8 (highest probability: 0.8).
- Middle layer: Values range from 0.1 to 0.5.
- Bottom layer: Values range from 0.1 to 0.5.
### Key Observations
- **Hierarchical Flow**: Input embeddings are processed through three identical layers, with outputs feeding into subsequent layers.
- **Probability Trends**:
- Top layer predicts the highest probabilities (up to 0.8).
- Middle and bottom layers show lower maximum probabilities (0.5).
- **Embedding Consistency**: Input and word embeddings maintain similar value ranges across layers.
- **Scaling Factor**: The "×N" notation near word embeddings suggests a multiplicative scaling parameter.
### Interpretation
The diagram represents a recurrent or stacked architecture where each layer refines predictions based on prior outputs. The top layer’s higher predicted probabilities (e.g., 0.8) suggest it may act as a final decision layer, while lower layers contribute progressively smaller adjustments. The "×N" scaling implies word embeddings are modulated by a global factor, potentially balancing input and learned representations. The consistent hidden size across layers indicates uniform dimensionality in processing.
This architecture likely models sequential dependencies, with each layer capturing increasingly abstract features before outputting token probabilities. The green rectangles’ values reflect confidence scores for token predictions at each stage.