# Technical Document Extraction: Reinforcement Learning Papers Growth (2005-2020)
## 1. Image Classification and Overview
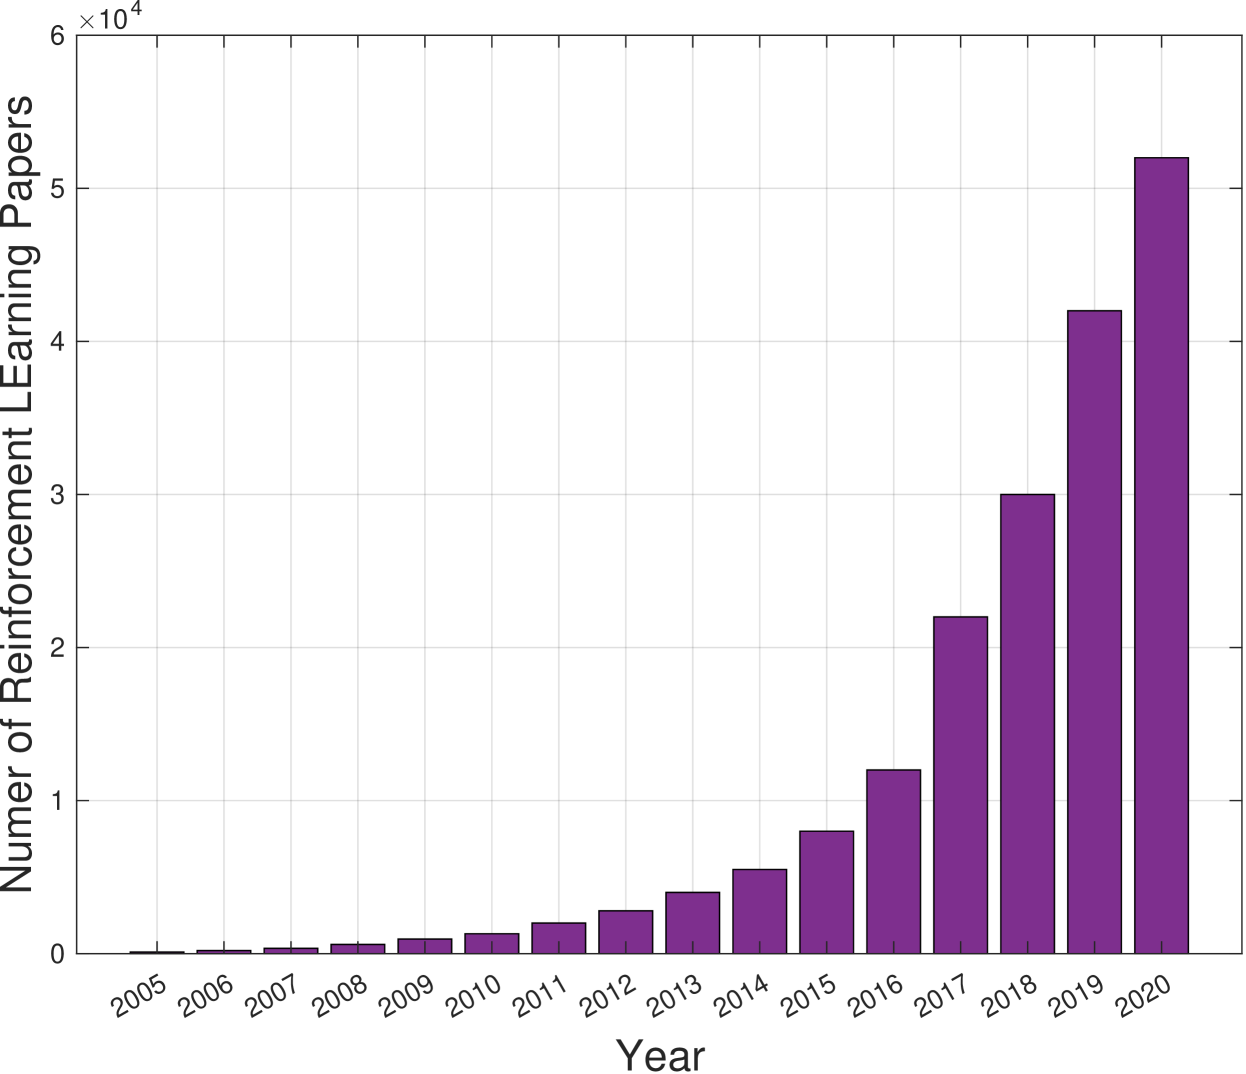
This image is a **vertical bar chart** illustrating the annual growth in the number of published papers related to Reinforcement Learning over a 16-year period. The chart displays an exponential growth trend, particularly accelerating after 2015.
## 2. Component Isolation
### Header/Metadata
* **Top-Left Multiplier:** $\times 10^4$ (Indicates that the Y-axis values must be multiplied by 10,000).
### Main Chart Area
* **X-Axis Label:** "Year"
* **Y-Axis Label:** "Numer of Reinforcement LEarning Papers" (Note: Original text contains typos: "Numer" instead of "Number" and "LEarning" with a capitalized 'E').
* **Grid:** A light gray rectangular grid is present to facilitate value estimation.
* **Data Series:** 16 purple bars with black outlines.
### Footer
* No footer text or citations are present in the image.
---
## 3. Data Extraction
### Axis Scales
* **X-Axis:** Categorical years ranging from **2005** to **2020**.
* **Y-Axis:** Numerical scale from **0 to 6** (representing 0 to 60,000). Major tick marks are placed at intervals of 1 ($1 \times 10^4$).
### Trend Verification
The data series follows a **super-linear/exponential growth curve**.
* **2005–2012:** The growth is marginal, with the total count remaining well below 5,000 papers.
* **2013–2015:** A visible uptick begins, crossing the 5,000 mark.
* **2016–2020:** Rapid acceleration occurs. The volume of papers more than quadruples within these five years, reaching its peak in 2020.
### Reconstructed Data Table
*Values are estimated based on the Y-axis grid alignment ($1 \text{ unit} = 10,000 \text{ papers}$).*
| Year | Estimated Value (Y-axis units) | Calculated Number of Papers |
| :--- | :--- | :--- |
| 2005 | ~0.01 | ~100 |
| 2006 | ~0.02 | ~200 |
| 2007 | ~0.03 | ~300 |
| 2008 | ~0.05 | ~500 |
| 2009 | ~0.08 | ~800 |
| 2010 | ~0.12 | ~1,200 |
| 2011 | ~0.18 | ~1,800 |
| 2012 | ~0.25 | ~2,500 |
| 2013 | ~0.40 | ~4,000 |
| 2014 | ~0.55 | ~5,500 |
| 2015 | ~0.80 | ~8,000 |
| 2016 | ~1.20 | ~12,000 |
| 2017 | ~2.20 | ~22,000 |
| 2018 | ~3.00 | ~30,000 |
| 2019 | ~4.20 | ~42,000 |
| 2020 | ~5.20 | ~52,000 |
---
## 4. Precise Text Transcription
The following text is extracted exactly as it appears in the image, including case sensitivity and spelling:
* **Y-Axis:** `Numer of Reinforcement LEarning Papers`
* **X-Axis:** `Year`
* **Y-Axis Multiplier:** `x 10^4`
* **X-Axis Markers:** `2005`, `2006`, `2007`, `2008`, `2009`, `2010`, `2011`, `2012`, `2013`, `2014`, `2015`, `2016`, `2017`, `2018`, `2019`, `2020`
* **Y-Axis Markers:** `0`, `1`, `2`, `3`, `4`, `5`, `6`
## 5. Language Declaration
The text in this image is entirely in **English**. No other languages were detected.