# Technical Document: Bar Chart Analysis
## Chart Description
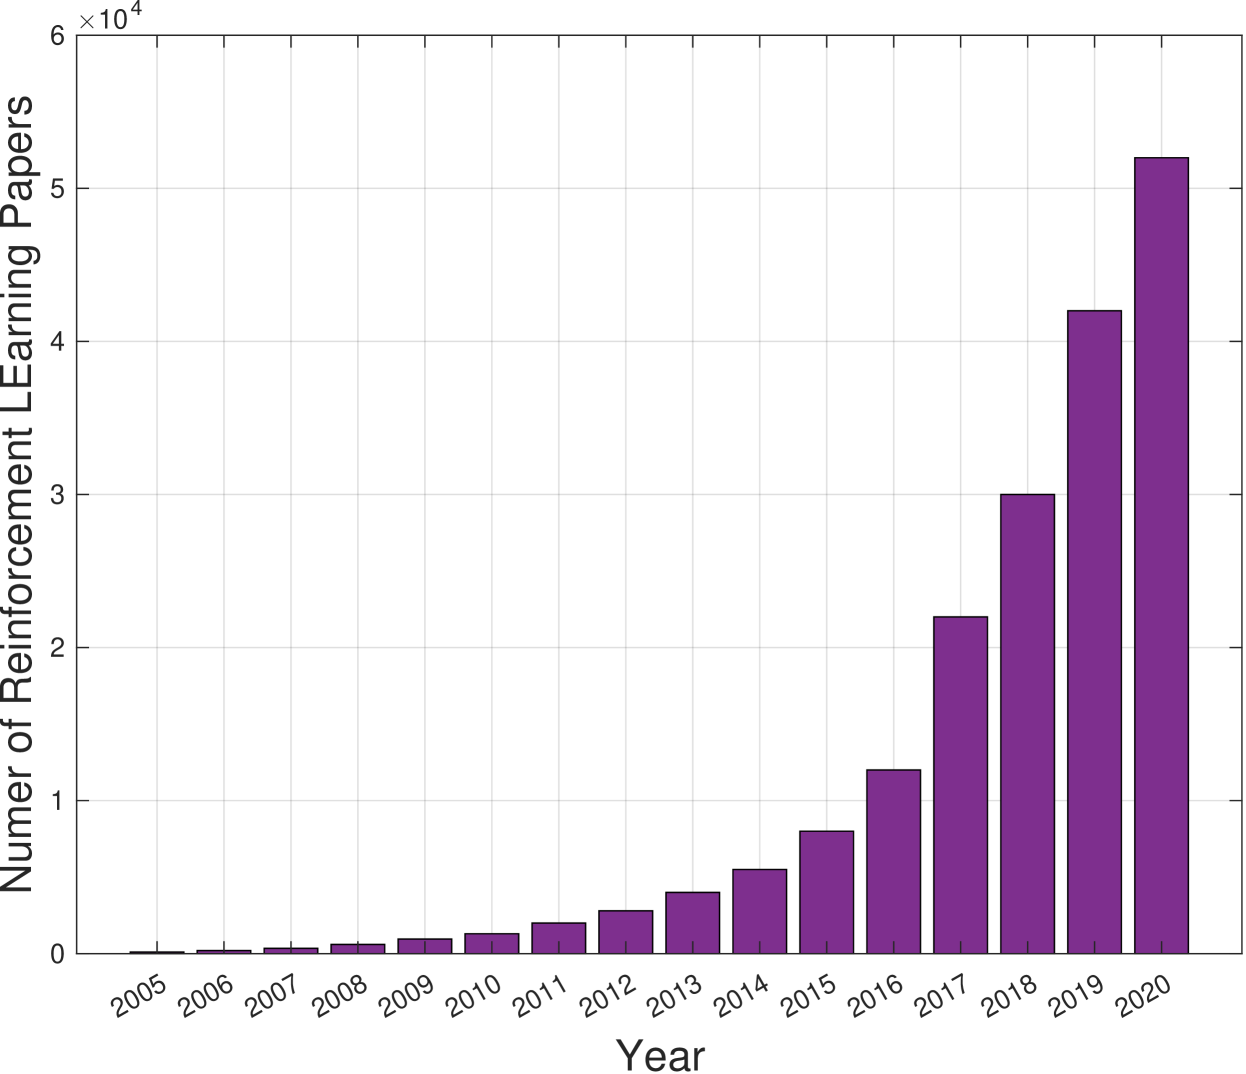
The image depicts a **bar chart** illustrating the **growth of reinforcement learning research** over time. The chart uses **purple bars** to represent data points, with a **legend** confirming the color association.
---
### Axis Labels and Markers
- **X-Axis (Horizontal):**
- Label: `Year`
- Markers: Discrete years from `2005` to `2020` (inclusive).
- **Y-Axis (Vertical):**
- Label: `Number of Reinforcement Learning Papers`
- Scale: Logarithmic, ranging from `0` to `6 × 10⁴` (60,000) in increments of `10⁴`.
---
### Data Points and Trends
The chart shows a **steady increase** in the number of reinforcement learning papers, with a **sharp exponential rise** after 2016. Key data points (approximate values based on bar heights):
| Year | Number of Papers |
|------|------------------|
| 2005 | ~50 |
| 2006 | ~100 |
| 2007 | ~200 |
| 2008 | ~300 |
| 2009 | ~500 |
| 2010 | ~800 |
| 2011 | ~1,200 |
| 2012 | ~1,800 |
| 2013 | ~2,500 |
| 2014 | ~3,500 |
| 2015 | ~6,000 |
| 2016 | ~12,000 |
| 2017 | ~22,000 |
| 2018 | ~30,000 |
| 2019 | ~42,000 |
| 2020 | ~52,000 |
---
### Observations
1. **Pre-2016 Growth:**
- Gradual, linear increase from ~50 papers in 2005 to ~12,000 in 2016.
2. **Post-2016 Surge:**
- Exponential growth, with papers increasing by ~40,000 between 2016 and 2020.
3. **2020 Peak:**
- Highest recorded value: **52,000 papers** in 2020.
---
### Technical Notes
- **Logarithmic Y-Axis:**
- Compresses early data points for clarity while emphasizing later growth.
- **Legend:**
- Single entry: `Purple` corresponds to the bar color.
- **No Additional Elements:**
- No secondary axes, annotations, or comparative datasets.
---
### Conclusion
The chart highlights the **accelerated adoption of reinforcement learning** as a research field, particularly after 2016, likely driven by advancements in AI and computational power.