\n
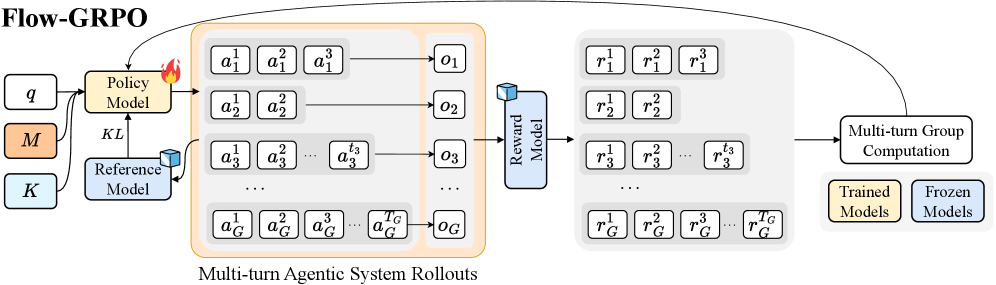
## Diagram: Flow-GRPO
### Overview
This diagram illustrates the Flow-GRPO (likely an acronym for a reinforcement learning algorithm) process, depicting the interaction between a Policy Model, a Reference Model, and a Reward Model across multiple turns of agentic system rollouts. The diagram shows how actions are generated, observations are received, and rewards are calculated, with a distinction between trained and frozen models.
### Components/Axes
The diagram consists of the following key components:
* **Policy Model:** Represented by a flame icon, receiving input 'q' and outputting actions (a).
* **Reference Model:** Represented by a cube icon, receiving input 'K' and contributing to the KL divergence calculation.
* **Reward Model:** Represented by a cube icon, receiving observations (o) and outputting rewards (r).
* **Multi-turn Agentic System Rollouts:** A grid-like structure showing the sequence of actions, observations, and rewards across multiple turns (1 to G).
* **Multi-turn Group Computation:** A box indicating the aggregation of results across turns.
* **KL:** Label indicating the Kullback-Leibler divergence calculation.
* **Legend:** Distinguishes between "Trained Models" (light green) and "Frozen Models" (light blue).
* **Inputs:** 'q', 'M', 'K' are labeled as inputs.
* **Outputs:** 'a', 'o', 'r' are labeled as outputs.
### Detailed Analysis or Content Details
The diagram shows a flow from left to right.
1. **Inputs:** The process begins with inputs 'q', 'M', and 'K'. 'q' feeds into the Policy Model. 'K' feeds into the Reference Model. 'M' is connected to the KL divergence calculation.
2. **Policy Model & Actions:** The Policy Model generates a series of actions (a<sub>1</sub><sup>1</sup>, a<sub>1</sub><sup>2</sup>, a<sub>1</sub><sup>3</sup>, ... a<sub>G</sub><sup>1</sup>, a<sub>G</sub><sup>2</sup>, a<sub>G</sub><sup>3</sup>, ... a<sub>G</sub><sup>G</sup>) across G turns. The actions are arranged in a grid of G rows and G columns.
3. **Observations:** These actions lead to a series of observations (o<sub>1</sub>, o<sub>2</sub>, o<sub>3</sub>, ... o<sub>G</sub>).
4. **Reward Model & Rewards:** The Reward Model receives the observations and outputs corresponding rewards (r<sub>1</sub><sup>1</sup>, r<sub>1</sub><sup>2</sup>, r<sub>1</sub><sup>3</sup>, ... r<sub>G</sub><sup>1</sup>, r<sub>G</sub><sup>2</sup>, r<sub>G</sub><sup>3</sup>, ... r<sub>G</sub><sup>G</sup>), also arranged in a G x G grid.
5. **Multi-turn Group Computation:** The outputs from the rollouts are then fed into a "Multi-turn Group Computation" block.
6. **Model Status:** The Policy Model and Reference Model are color-coded. The Policy Model is shown as a light green box, indicating it is a "Trained Model". The Reference Model is shown as a light blue box, indicating it is a "Frozen Model". The Reward Model is also light green, indicating it is a "Trained Model".
### Key Observations
* The diagram emphasizes the iterative nature of the process, with multiple turns of agentic rollouts.
* The distinction between trained and frozen models suggests a specific training strategy where some models are updated while others remain fixed.
* The KL divergence calculation likely plays a role in regularizing the Policy Model's behavior relative to the Reference Model.
* The grid structure of actions and rewards indicates a parallel or batched processing of multiple rollouts.
### Interpretation
The Flow-GRPO diagram represents a reinforcement learning framework that leverages a reference model to guide the training of a policy model. The use of a frozen reference model suggests a desire to maintain a certain level of stability or prior knowledge during learning. The multi-turn rollouts and group computation indicate that the algorithm explores a range of possible actions and evaluates their cumulative rewards. The KL divergence term likely encourages the policy to stay close to the reference model, preventing it from deviating too far from established behavior. The diagram highlights a sophisticated approach to reinforcement learning that combines elements of imitation learning (through the reference model) and exploration (through the policy model). The color coding of the models is crucial for understanding the training dynamics of the system. The diagram suggests a system designed for complex, multi-step decision-making tasks.