## Scatter Plots: CIM Methods vs dSBM Performance Comparison
### Overview
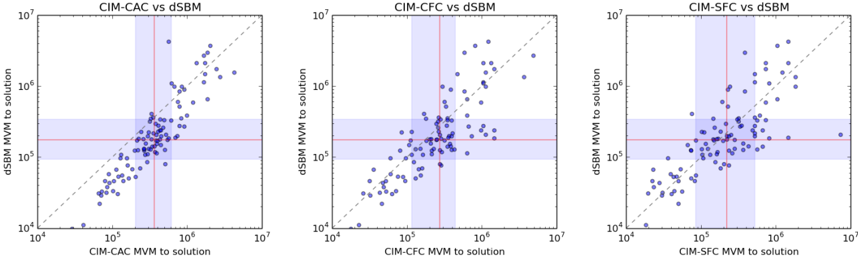
Three scatter plots compare the Mean Value Metric (MVM) performance of different CIM (Circuit-Level Image Modeling) methods (CAC, CFC, SFC) against dSBM (Distributed Stochastic Block Model) across logarithmic scales. Each plot visualizes the relationship between CIM method performance and dSBM performance, with statistical reference lines and shaded regions.
### Components/Axes
1. **X-Axes (CIM Method to Solution)**:
- Logarithmic scale from 10⁴ to 10⁷
- Labels: "CIM-CAC MVM to solution", "CIM-CFC MVM to solution", "CIM-SFC MVM to solution"
2. **Y-Axes (dSBM to Solution)**:
- Logarithmic scale from 10⁴ to 10⁷
- Label: "dSBM MVM to solution"
3. **Visual Elements**:
- **Dashed Line**: Diagonal line representing y = x (parity line)
- **Shaded Regions**:
- Vertical band (purple) centered at 10⁵–10⁶
- Horizontal band (pink) centered at 10⁵–10⁶
- **Data Points**: Blue dots representing individual measurements
### Detailed Analysis
1. **CIM-CAC vs dSBM**:
- Data points cluster around the dashed line, indicating similar performance between CIM-CAC and dSBM.
- Shaded regions suggest most data points fall within 10⁵–10⁶ for both axes.
- Outliers: A few points deviate significantly (e.g., 10⁴–10⁵ on x-axis with y-axis >10⁶).
2. **CIM-CFC vs dSBM**:
- Similar clustering pattern to CIM-CAC, with tighter alignment to the dashed line.
- Shaded regions overlap with CIM-CAC, but fewer points exceed 10⁶ on either axis.
3. **CIM-SFC vs dSBM**:
- Broader spread of data points, with some extending beyond 10⁶ on both axes.
- Shaded regions remain consistent, but more points cluster near the lower bounds (10⁴–10⁵).
### Key Observations
- **Consistency**: All three CIM methods show strong alignment with dSBM near the parity line (y = x), suggesting comparable performance in the 10⁵–10⁶ range.
- **Variability**: CIM-SFC exhibits greater variability, with data points more dispersed across the log scale.
- **Statistical Bands**: The shaded regions (10⁵–10⁶) likely represent confidence intervals or typical performance bounds, with most data points falling within these bounds.
### Interpretation
The plots demonstrate that CIM methods (CAC, CFC, SFC) generally achieve performance comparable to dSBM, particularly in the mid-range (10⁵–10⁶). The shaded regions and dashed line serve as visual anchors for assessing agreement between methods. CIM-SFC shows the widest performance distribution, potentially indicating higher sensitivity to input variations or methodological differences. The absence of extreme outliers suggests robustness across methods, though CIM-SFC's broader spread warrants further investigation into its performance drivers. The logarithmic scale emphasizes relative differences, highlighting that performance gaps are more pronounced at the extremes (e.g., 10⁴ vs 10⁷).