## Chart: Training Accuracy and Average Parallelism vs Steps
### Overview
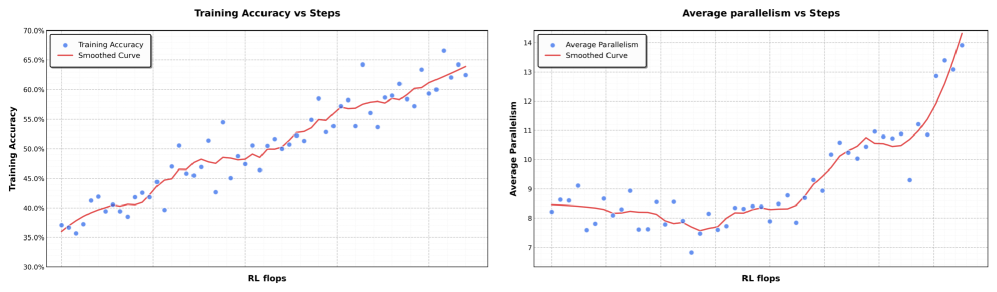
The image presents two scatter plots side-by-side, both charting data against "RL flops" on the x-axis. The left plot shows "Training Accuracy" versus "RL flops," while the right plot shows "Average Parallelism" versus "RL flops." Each plot includes a scatter plot of data points and a smoothed curve representing the general trend.
### Components/Axes
**Left Plot: Training Accuracy vs Steps**
* **Title:** Training Accuracy vs Steps
* **Y-axis:** Training Accuracy
* Scale: 30.0% to 70.0% in 5% increments.
* **X-axis:** RL flops
* **Data Series:**
* Training Accuracy (blue dots)
* Smoothed Curve (red line)
**Right Plot: Average Parallelism vs Steps**
* **Title:** Average parallelism vs Steps
* **Y-axis:** Average Parallelism
* Scale: 7 to 14 in increments of 1.
* **X-axis:** RL flops
* **Data Series:**
* Average Parallelism (blue dots)
* Smoothed Curve (red line)
### Detailed Analysis
**Left Plot: Training Accuracy vs Steps**
* **Training Accuracy (blue dots):** The data points are scattered, showing variability in training accuracy at different RL flops values.
* **Smoothed Curve (red line):** The smoothed curve generally slopes upward, indicating an overall increase in training accuracy as RL flops increase.
* At the beginning of the curve, the accuracy is approximately 38%.
* In the middle of the curve, the accuracy is approximately 48%.
* At the end of the curve, the accuracy is approximately 63%.
**Right Plot: Average Parallelism vs Steps**
* **Average Parallelism (blue dots):** The data points are scattered, showing variability in average parallelism at different RL flops values.
* **Smoothed Curve (red line):** The smoothed curve initially decreases slightly, then remains relatively stable, and finally increases sharply towards the end.
* At the beginning of the curve, the parallelism is approximately 8.5.
* In the middle of the curve, the parallelism is approximately 8.
* At the end of the curve, the parallelism is approximately 13.
### Key Observations
* The training accuracy generally increases with RL flops.
* The average parallelism initially decreases slightly, stabilizes, and then increases significantly at higher RL flops.
### Interpretation
The plots suggest that as the number of RL flops (a measure of computational effort or training steps) increases, the training accuracy of the model tends to improve. The average parallelism, after an initial dip, also increases significantly at higher RL flops, potentially indicating that the model is able to leverage more parallel processing as it trains further. The initial decrease in parallelism could be due to the model initially exploring different strategies before settling into a more parallelizable approach. The sharp increase in parallelism towards the end suggests that the model is becoming more efficient in its computations as it learns.