\n
## Bar Chart: Full Configuration vs Single Feature Removed
### Overview
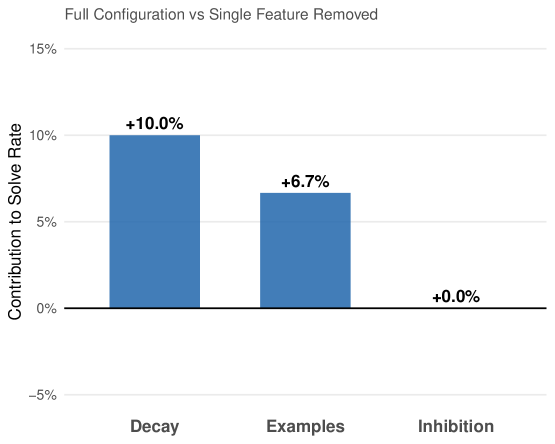
This bar chart compares the contribution to solve rate when individual features (Decay, Examples, Inhibition) are removed from a full configuration. The y-axis represents the percentage contribution to the solve rate, and the x-axis lists the features being removed. Each bar represents the change in solve rate when that feature is removed.
### Components/Axes
* **Title:** "Full Configuration vs Single Feature Removed" - positioned at the top-center of the chart.
* **X-axis Label:** Features removed: "Decay", "Examples", "Inhibition" - positioned along the bottom of the chart.
* **Y-axis Label:** "Contribution to Solve Rate" - positioned on the left side of the chart.
* **Y-axis Scale:** Ranges from -5% to 15%, with increments of 5%.
* **Bars:** Three bars representing the contribution of each feature.
* **Data Labels:** Percentage values displayed above each bar.
### Detailed Analysis
The chart displays three bars, each representing the change in solve rate when a specific feature is removed.
* **Decay:** The bar for "Decay" is the tallest, reaching approximately +10.0%. The label above the bar reads "+10.0%".
* **Examples:** The bar for "Examples" is of intermediate height, reaching approximately +6.7%. The label above the bar reads "+6.7%".
* **Inhibition:** The bar for "Inhibition" is the shortest, reaching approximately +0.0%. The label above the bar reads "+0.0%".
The bars are all the same shade of blue.
### Key Observations
* Removing "Decay" has the largest positive impact on the solve rate (+10.0%).
* Removing "Examples" has a moderate positive impact on the solve rate (+6.7%).
* Removing "Inhibition" has a negligible impact on the solve rate (+0.0%).
* All features contribute positively to the solve rate, but to varying degrees.
### Interpretation
The data suggests that the "Decay" feature is the most critical component of the full configuration, as its removal leads to the largest decrease in solve rate. The "Examples" feature is also important, but to a lesser extent. The "Inhibition" feature appears to have minimal impact on the solve rate, suggesting it may be redundant or less effective than the other two features.
This information could be used to optimize the configuration by focusing on strengthening the "Decay" and "Examples" features, or potentially removing the "Inhibition" feature without significantly impacting performance. The chart demonstrates the relative importance of each feature in contributing to the overall solve rate. The positive values indicate that removing any of these features *decreases* the solve rate compared to the full configuration.