## Bar Chart: Full Configuration vs Single Feature Removed
### Overview
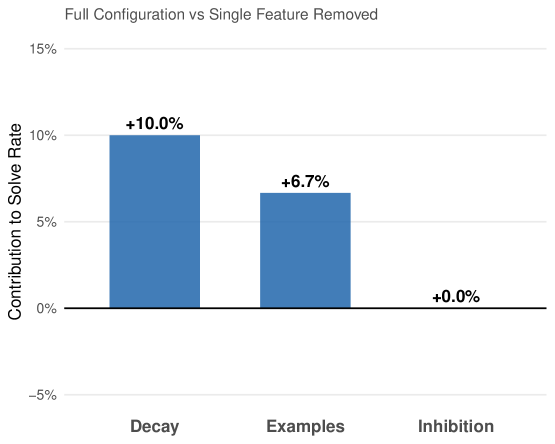
This is a vertical bar chart illustrating the impact on a "Solve Rate" when specific features are removed from a full system configuration. The chart quantifies the contribution of three distinct features—Decay, Examples, and Inhibition—by showing the percentage change in the solve rate when each is individually removed.
### Components/Axes
* **Chart Title:** "Full Configuration vs Single Feature Removed" (top center).
* **Y-Axis:**
* **Label:** "Contribution to Solve Rate" (rotated vertically on the left).
* **Scale:** Linear scale with percentage markers at -5%, 0%, 5%, 10%, and 15%.
* **Baseline:** A solid black horizontal line at the 0% mark.
* **X-Axis:**
* **Categories:** Three categorical labels positioned below their respective bars: "Decay", "Examples", "Inhibition".
* **Data Series:** A single series represented by three blue vertical bars. Each bar has a data label directly above it stating its exact value.
* **Legend:** Not present. The categories are directly labeled on the x-axis.
### Detailed Analysis
The chart presents the following data points, from left to right:
1. **Decay:**
* **Visual Trend:** The tallest bar, extending significantly above the 0% baseline.
* **Value:** `+10.0%` (labeled above the bar).
* **Interpretation:** Removing the "Decay" feature from the full configuration results in a 10.0% *increase* in the solve rate.
2. **Examples:**
* **Visual Trend:** A bar of moderate height, shorter than the "Decay" bar but still clearly positive.
* **Value:** `+6.7%` (labeled above the bar).
* **Interpretation:** Removing the "Examples" feature results in a 6.7% *increase* in the solve rate.
3. **Inhibition:**
* **Visual Trend:** No visible bar height; the data point sits exactly on the 0% baseline.
* **Value:** `+0.0%` (labeled above the baseline).
* **Interpretation:** Removing the "Inhibition" feature has no measurable effect (0.0% change) on the solve rate.
### Key Observations
* **Positive Impact of Removal:** Both "Decay" and "Examples" show a positive contribution when removed, indicating their presence in the full configuration *lowers* the solve rate.
* **Magnitude of Impact:** The "Decay" feature has the most significant negative impact on performance (its removal yields the largest gain). "Examples" has a moderate negative impact.
* **Neutral Feature:** The "Inhibition" feature appears to be neutral or non-contributory in this context, as its removal causes no change.
* **Data Presentation:** Values are presented with one decimal place of precision. All changes are expressed as positive percentages relative to the full configuration's baseline.
### Interpretation
This chart is an **ablation study** result, a common technique in machine learning and systems engineering to understand the contribution of individual components. The data suggests the following:
1. **Counterintuitive Findings:** The features "Decay" and "Examples" are not helping the system solve the target problem; they are actively hindering it. Their removal improves performance. This could indicate they are poorly tuned, introduce noise, or are misaligned with the task objective.
2. **Feature Utility:** The "Inhibition" feature, in this specific configuration and evaluation, provides no benefit or detriment. It may be redundant, inactive, or its effects are perfectly balanced by other components.
3. **Optimization Direction:** To improve the system's solve rate, the primary focus should be on understanding why "Decay" and "Examples" are detrimental. The next step would be to either remove them entirely, re-engineer them, or investigate if they are interacting negatively with other parts of the system. The "Inhibition" feature could potentially be removed to simplify the model without affecting performance.
4. **Underlying Assumption:** The chart measures the *marginal contribution* of each feature when absent. The full configuration's solve rate is the implicit baseline (0% change). A positive value means the feature was a net negative in the complete system.