## Bar Chart: Full Configuration vs Single Feature Removed
### Overview
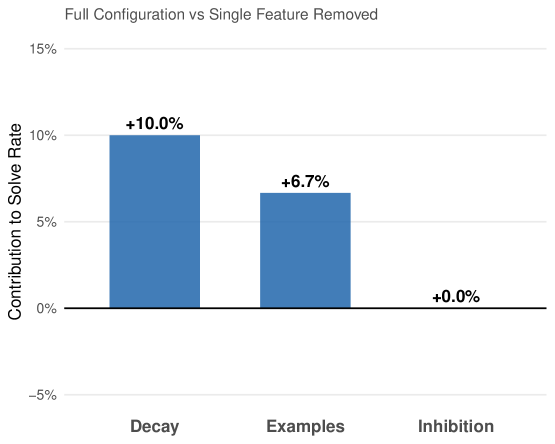
The chart compares the contribution of three features (Decay, Examples, Inhibition) to the "Solve Rate" when removed from a full configuration. The y-axis represents percentage contribution, ranging from -5% to 15%, while the x-axis lists the features. All bars are blue, with numerical labels indicating exact contributions.
### Components/Axes
- **Title**: "Full Configuration vs Single Feature Removed" (top-center)
- **Y-Axis**: "Contribution to Solve Rate" (percentage scale: -5% to 15%, increments of 5%)
- **X-Axis**: Three categories: "Decay" (left), "Examples" (center), "Inhibition" (right)
- **Legend**: Single entry: "Blue" (top-right corner, matching all bars)
- **Bar Labels**:
- Decay: +10.0% (left bar)
- Examples: +6.7% (center bar)
- Inhibition: +0.0% (right bar)
### Detailed Analysis
- **Decay**: Tallest bar at +10.0%, positioned leftmost. Contribution is the highest among all features.
- **Examples**: Medium-height bar at +6.7%, centered. Contribution is 3.3% lower than Decay.
- **Inhibition**: Shortest bar at +0.0%, rightmost. No measurable contribution to solve rate.
### Key Observations
1. **Decay** has the largest positive impact (+10.0%) when removed.
2. **Examples** contributes moderately (+6.7%) when removed.
3. **Inhibition** has no effect (+0.0%) when removed.
4. All contributions are positive, suggesting feature removal improves solve rate.
### Interpretation
The data demonstrates that removing the "Decay" feature yields the most significant improvement in solve rate, followed by "Examples." "Inhibition" appears neutral, indicating it does not influence solve rate. This suggests prioritizing "Decay" and "Examples" for optimization in the full configuration. The absence of negative contributions implies no features degrade performance when removed. The chart likely informs feature prioritization in system design or troubleshooting.