## Chart: AUC-PR vs. Number of Samples for Different SelfCk Methods
### Overview
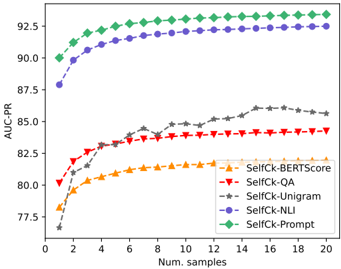
The image is a line chart comparing the AUC-PR (Area Under the Precision-Recall Curve) performance of five different "SelfCk" methods as the number of samples increases. The chart displays how the performance of each method improves with more samples.
### Components/Axes
* **Y-axis:** AUC-PR (Area Under the Precision-Recall Curve). Scale ranges from 77.5 to 92.5.
* **X-axis:** Num. samples (Number of samples). Scale ranges from 0 to 20.
* **Legend:** Located in the bottom-right corner, identifying each line by its corresponding "SelfCk" method:
* SelfCk-BERTScore (Orange triangles)
* SelfCk-QA (Red inverted triangles)
* SelfCk-Unigram (Gray stars)
* SelfCk-NLI (Blue circles)
* SelfCk-Prompt (Green diamonds)
### Detailed Analysis
* **SelfCk-Prompt (Green Diamonds):**
* Trend: Starts high and plateaus quickly.
* Data Points: Starts at approximately 90.0 at sample 1, reaches approximately 92.5 by sample 4, and remains relatively stable around 93.0 from sample 10 onwards.
* **SelfCk-NLI (Blue Circles):**
* Trend: Starts lower than SelfCk-Prompt but also plateaus quickly.
* Data Points: Starts at approximately 88.0 at sample 1, reaches approximately 91.5 by sample 4, and stabilizes around 92.0 from sample 10 onwards.
* **SelfCk-Unigram (Gray Stars):**
* Trend: Gradual increase with some fluctuations.
* Data Points: Starts at approximately 77.0 at sample 1, reaches approximately 84.0 by sample 8, and fluctuates around 86.0 from sample 15 onwards.
* **SelfCk-QA (Red Inverted Triangles):**
* Trend: Gradual increase, similar to SelfCk-Unigram.
* Data Points: Starts at approximately 80.0 at sample 1, reaches approximately 83.5 by sample 6, and stabilizes around 84.0 from sample 12 onwards.
* **SelfCk-BERTScore (Orange Triangles):**
* Trend: Starts low, increases, then plateaus.
* Data Points: Starts at approximately 79.0 at sample 1, reaches approximately 81.0 by sample 4, and stabilizes around 81.5 from sample 8 onwards.
### Key Observations
* SelfCk-Prompt and SelfCk-NLI consistently outperform the other methods.
* SelfCk-Unigram and SelfCk-QA show similar performance trends.
* SelfCk-BERTScore has the lowest performance among the five methods.
* All methods show diminishing returns as the number of samples increases, with most plateauing after approximately 10 samples.
### Interpretation
The chart demonstrates the performance of different "SelfCk" methods in relation to the number of samples used. SelfCk-Prompt and SelfCk-NLI appear to be the most effective, achieving higher AUC-PR scores with fewer samples. The diminishing returns suggest that increasing the number of samples beyond a certain point (around 10) does not significantly improve the performance of any of the methods. The relative performance of each method provides insights into their effectiveness in the given task, with SelfCk-BERTScore being the least effective among those tested.