## Line Chart: Performance Comparison of SelfCk Methods
### Overview
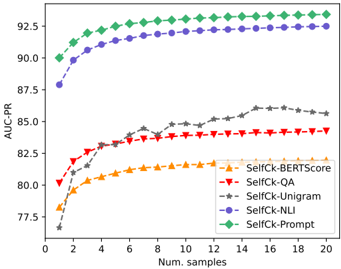
The image is a line chart comparing the performance of five different "SelfCk" methods as a function of the number of samples used. The performance metric is AUC-PR (Area Under the Precision-Recall Curve). The chart demonstrates how the effectiveness of each method scales with increasing sample size.
### Components/Axes
* **X-Axis:** Labeled "Num. samples". The scale runs from 0 to 20, with major tick marks at every increment of 2 (0, 2, 4, ..., 20).
* **Y-Axis:** Labeled "AUC-PR". The scale runs from approximately 77.5 to 92.5, with major tick marks at 77.5, 80.0, 82.5, 85.0, 87.5, 90.0, and 92.5.
* **Legend:** Located in the bottom-right quadrant of the chart area. It contains five entries, each associating a line color and marker shape with a method name:
* Orange line with upward-pointing triangles: `SelfCk-BERTScore`
* Red line with downward-pointing triangles: `SelfCk-QA`
* Grey line with stars: `SelfCk-Unigram`
* Purple line with circles: `SelfCk-NLI`
* Green line with diamonds: `SelfCk-Prompt`
### Detailed Analysis
The chart plots five data series. The general trend for all series is an increase in AUC-PR as the number of samples increases, with the rate of improvement diminishing (plateauing) for higher sample counts.
**1. SelfCk-Prompt (Green Diamonds)**
* **Trend:** This is the top-performing method across all sample sizes. It shows a steep initial increase from 1 to about 6 samples, followed by a very gradual, steady rise.
* **Approximate Data Points:** Starts at ~90.0 (1 sample), rises to ~91.5 (4 samples), ~92.2 (10 samples), and ends at approximately 93.0 (20 samples).
**2. SelfCk-NLI (Purple Circles)**
* **Trend:** This is the second-best performing method. Its trajectory closely mirrors SelfCk-Prompt but is consistently about 1.5-2.0 AUC-PR points lower.
* **Approximate Data Points:** Starts at ~88.0 (1 sample), rises to ~90.5 (4 samples), ~91.8 (10 samples), and ends at approximately 92.5 (20 samples).
**3. SelfCk-Unigram (Grey Stars)**
* **Trend:** This method shows the most volatile performance. It starts as the lowest-performing method but exhibits a strong, somewhat erratic upward trend, surpassing SelfCk-BERTScore and SelfCk-QA after about 6 samples. It appears to plateau around 16 samples.
* **Approximate Data Points:** Starts at ~76.5 (1 sample), rises sharply to ~82.5 (6 samples), fluctuates around ~84.0-85.0 (10-14 samples), peaks at ~86.0 (16 samples), and ends at approximately 85.5 (20 samples).
**4. SelfCk-QA (Red Downward Triangles)**
* **Trend:** This method shows a smooth, steady increase that begins to plateau noticeably after about 8 samples.
* **Approximate Data Points:** Starts at ~80.0 (1 sample), rises to ~83.0 (6 samples), ~84.0 (10 samples), and ends at approximately 84.5 (20 samples).
**5. SelfCk-BERTScore (Orange Upward Triangles)**
* **Trend:** This method has the lowest performance for most of the range after the initial samples. It shows a smooth, steady increase that plateaus early.
* **Approximate Data Points:** Starts at ~78.0 (1 sample), rises to ~81.0 (6 samples), ~82.0 (10 samples), and ends at approximately 82.5 (20 samples).
### Key Observations
1. **Clear Performance Tiers:** The methods fall into two distinct groups. `SelfCk-Prompt` and `SelfCk-NLI` form a high-performance tier (AUC-PR > 88). `SelfCk-Unigram`, `SelfCk-QA`, and `SelfCk-BERTScore` form a lower-performance tier (AUC-PR < 86).
2. **Convergence with More Data:** The performance gap between the top two methods and the bottom three narrows as the number of samples increases, but a significant gap remains.
3. **Crossover Event:** `SelfCk-Unigram` starts poorly but demonstrates the highest growth rate, eventually surpassing both `SelfCk-QA` and `SelfCk-BERTScore`.
4. **Plateauing:** All methods show diminishing returns. The most significant performance gains occur within the first 6-8 samples.
### Interpretation
This chart provides a comparative analysis of automated evaluation metrics (the "SelfCk" methods). The data suggests a clear hierarchy in effectiveness for the task being measured:
* **Superior Methods:** `SelfCk-Prompt` (likely using a prompted LLM) and `SelfCk-NLI` (Natural Language Inference based) are significantly more reliable and data-efficient, achieving high AUC-PR scores even with few samples. Their parallel trajectories suggest they may be measuring similar underlying qualities of the text.
* **Variable Method:** `SelfCk-Unigram` (likely based on simple word overlap) is highly sensitive to the amount of training data. Its poor start but strong finish indicates it requires a substantial sample size to become competitive, and its volatility suggests it may be less robust.
* **Baseline Methods:** `SelfCk-QA` and `SelfCk-BERTScore` offer stable but mediocre performance. They plateau early, indicating a fundamental ceiling in their ability to capture the target phenomenon, regardless of more data.
**Overall Implication:** For tasks requiring accurate, sample-efficient evaluation, prompt-based or NLI-based methods are preferable. Simpler lexical methods like Unigram require more data to be useful and may be less consistent. The chart argues for investing in more sophisticated semantic evaluation metrics over traditional string-matching techniques.