## Diagram: State Transition Diagram
### Overview
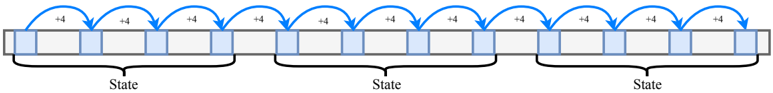
The image is a diagram illustrating state transitions. It shows a linear sequence of boxes, some shaded blue, representing states. Blue arrows indicate transitions between states, each transition adding +4. The diagram is divided into three sections labeled "State".
### Components/Axes
* **Boxes:** Represent individual states. Some boxes are shaded light blue.
* **Arrows:** Blue curved arrows indicate transitions between states. Each arrow is labeled with "+4".
* **State Labels:** Black curly braces with the label "State" underneath, indicating a group of states. There are three such labels.
### Detailed Analysis
The diagram consists of a horizontal sequence of 15 boxes. The boxes alternate between being shaded light blue and being unshaded. The first box is shaded light blue.
* **Transitions:** Each transition moves forward by 4 boxes. The arrows start above a shaded box and point down to another shaded box 4 positions to the right. Each arrow is labeled "+4".
* **State Groupings:** The 15 boxes are divided into three groups labeled "State". The first group contains 5 boxes, the second group contains 5 boxes, and the third group contains 5 boxes.
### Key Observations
* The diagram shows a consistent pattern of state transitions, each adding +4.
* The "State" labels group the boxes into equal segments.
* The shaded boxes are the targets of the state transitions.
### Interpretation
The diagram represents a system where the state advances by +4 units at each transition. The "State" labels likely indicate distinct phases or stages within the overall system. The alternating shaded and unshaded boxes might represent different properties or conditions within each state. The diagram suggests a cyclical or repetitive process, as the transitions consistently add +4 and the pattern of shaded boxes repeats.