## Diagram: State Transition Sequence with Incremental Steps
### Overview
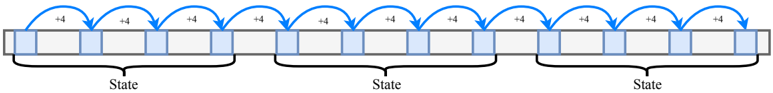
The image displays a technical diagram illustrating a sequential process or data structure organized into repeating states. It features a horizontal array of rectangular cells, grouped into three distinct states, with directional arrows indicating transitions between specific cells labeled with an incremental value.
### Components/Axes
* **Main Structure:** A single horizontal row of 15 contiguous rectangular cells (boxes).
* **Cell Coloring:** The cells follow a repeating pattern. The first cell in each group of four is shaded light blue, while the subsequent three cells are white (unshaded).
* **Transitions (Arrows):** Above the row of cells, there are 12 curved blue arrows. Each arrow originates from a blue-shaded cell and points to the next blue-shaded cell to its right, skipping over the three intervening white cells.
* **Transition Labels:** Every arrow is labeled with the text **"+4"** in black font, positioned at the apex of the curve.
* **Groupings (Braces):** Below the row of cells, there are three black curly braces (brackets).
* The first brace spans the first four cells (positions 1-4).
* The second brace spans the next four cells (positions 5-8).
* The third brace spans the final four cells (positions 9-12).
* *Note: The diagram shows 15 cells total, but the braces only group the first 12. The final three cells (13-15) are ungrouped.*
* **Group Labels:** Centered beneath each of the three braces is the label **"State"** in black text.
### Detailed Analysis
The diagram depicts a clear, repeating pattern:
1. **State Structure:** Each labeled "State" consists of a sequence of four cells. The pattern within each state is: `[Blue Cell] - [White Cell] - [White Cell] - [White Cell]`.
2. **Transition Logic:** The "+4" arrows define the progression rule. Moving from one blue cell to the next blue cell requires a step of +4 positions along the array. This visually represents a fixed stride or offset.
3. **Spatial Grounding:**
* The first "+4" arrow connects the blue cell at position 1 (within the first State) to the blue cell at position 5 (the start of the second State).
* The second "+4" arrow connects the blue cell at position 5 to the blue cell at position 9 (the start of the third State).
* This pattern continues, with each arrow bridging the gap between the start of one State and the start of the next.
4. **Data Point Verification:** The color of the arrow's origin and terminus (blue cells) consistently matches the pattern defined by the "State" groupings. The "+4" label corresponds exactly to the number of cells spanned by the arrow (from index `n` to index `n+4`).
### Key Observations
* **Repeating Pattern:** The core unit is a 4-cell block with a specific color pattern, labeled as a "State."
* **Fixed Stride:** The transition between identical points in consecutive states (blue cell to blue cell) is always a fixed increment of +4.
* **Incomplete Final Group:** The diagram shows 15 cells, but only three complete 4-cell "States" are bracketed and labeled. The last three cells (13, 14, 15) are present but not part of a labeled group, suggesting the sequence may continue or that this is a segment of a larger structure.
* **Visual Emphasis:** The blue shading and curved arrows highlight the active or primary elements (the starting cell of each state) and the path of progression between them.
### Interpretation
This diagram is a visual model for a **strided access pattern** or a **state machine with fixed transitions**. It demonstrates how to navigate a linear sequence (like an array, memory buffer, or timeline) by jumping in fixed increments.
* **What it suggests:** The data or process is organized into discrete, identical chunks ("States"). To move from the beginning of one chunk to the beginning of the next, you advance by a fixed number of steps (4). This is a fundamental concept in computer science for iterating through structures like arrays with a specific step size, or in signal processing for sampling data at regular intervals.
* **Relationships:** The "State" braces define the logical grouping, while the "+4" arrows define the operational rule for moving between these groups. The blue cells act as anchor points or headers for each state.
* **Anomalies/Notes:** The presence of three ungrouped cells at the end is the only break in the perfect pattern. This could indicate an incomplete diagram, a buffer with extra capacity, or that the final state is partial. The diagram effectively communicates a rule without needing to show an infinite sequence.