## Diagram: Sheep Identification Process
### Overview
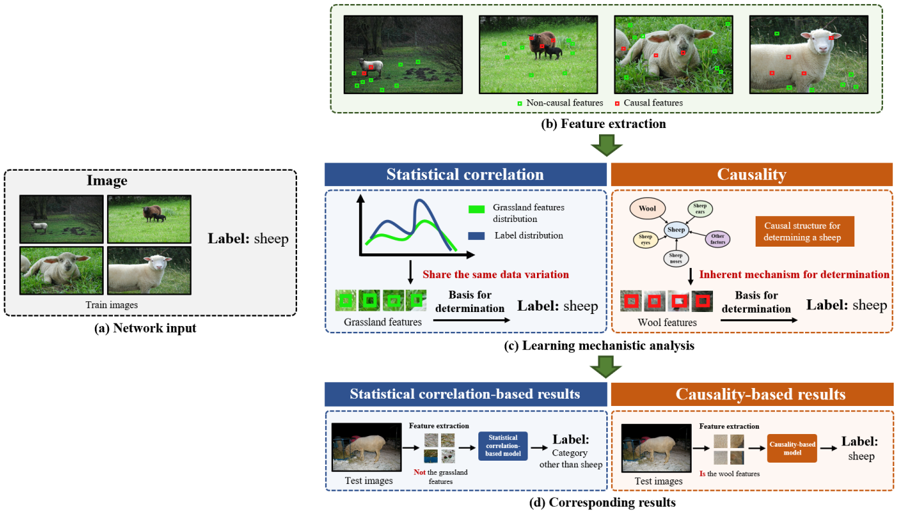
The image illustrates a process for identifying sheep using both statistical correlation and causality-based methods. It outlines the network input, feature extraction, learning mechanistic analysis, and corresponding results for both approaches.
### Components/Axes
* **(a) Network Input:** Shows four images labeled as "Train images" with the overall "Label: sheep".
* **(b) Feature Extraction:** Displays images with highlighted features. Green squares indicate "Non-causal features," and red squares indicate "Causal features."
* **(c) Learning Mechanistic Analysis:** This section is divided into two parts:
* **Statistical Correlation:** A graph shows two distributions: "Grassland features distribution" (green line) and "Label distribution" (blue line). An arrow points down to "Grassland features" with the text "Share the same data variation" and "Basis for determination Label: sheep".
* **Causality:** A diagram shows "Sheep" at the center, connected to "Wool", "Sheep eyes", "Sheep noses", and "Other factors". A text box states "Causal structure for determining a sheep". An arrow points down to "Wool features" with the text "Inherent mechanism for determination" and "Basis for determination Label: sheep".
* **(d) Corresponding Results:** This section is also divided into two parts:
* **Statistical Correlation-based results:** Shows "Test images" undergoing "Feature extraction" and being processed by a "Statistical correlation-based model" leading to the "Label: Category other than sheep" if "Not the grassland features" are detected.
* **Causality-based results:** Shows "Test images" undergoing "Feature extraction" and being processed by a "Causality-based model" leading to the "Label: sheep" if "Is the wool features" are detected.
### Detailed Analysis
* **Network Input (a):** The network is trained using images of sheep, which are labeled accordingly.
* **Feature Extraction (b):** The process identifies both causal (red) and non-causal (green) features in the images. Causal features are directly related to the object (sheep), while non-causal features are related to the background or environment.
* **Learning Mechanistic Analysis (c):**
* **Statistical Correlation:** The graph shows the correlation between grassland features and the label distribution. The overlap suggests a statistical relationship between the presence of grassland and the identification of sheep.
* **Causality:** The diagram illustrates the causal factors that determine a sheep, such as wool, eyes, and nose. The "Inherent mechanism for determination" emphasizes the importance of these features.
* **Corresponding Results (d):**
* **Statistical Correlation-based results:** If the test image does not contain grassland features, it is labeled as "Category other than sheep".
* **Causality-based results:** If the test image contains wool features, it is labeled as "sheep".
### Key Observations
* The diagram contrasts two approaches: statistical correlation and causality.
* Statistical correlation relies on environmental features (grassland), while causality relies on inherent features (wool).
* The diagram highlights the importance of both types of features in identifying sheep.
### Interpretation
The diagram illustrates a machine learning approach to identifying sheep using two different methods: statistical correlation and causality. The statistical correlation method leverages the environment (grassland) as a feature, while the causality method focuses on the inherent characteristics of the sheep (wool, eyes, nose). The diagram suggests that a combination of both methods could lead to a more robust and accurate sheep identification system. The statistical correlation might be useful in certain environments, while the causality method provides a more direct and reliable identification based on the sheep's features. The diagram also highlights the potential for misclassification if relying solely on statistical correlation, as the presence of grassland does not guarantee the presence of sheep.