\n
## Diagram: Sheep Classification Process
### Overview
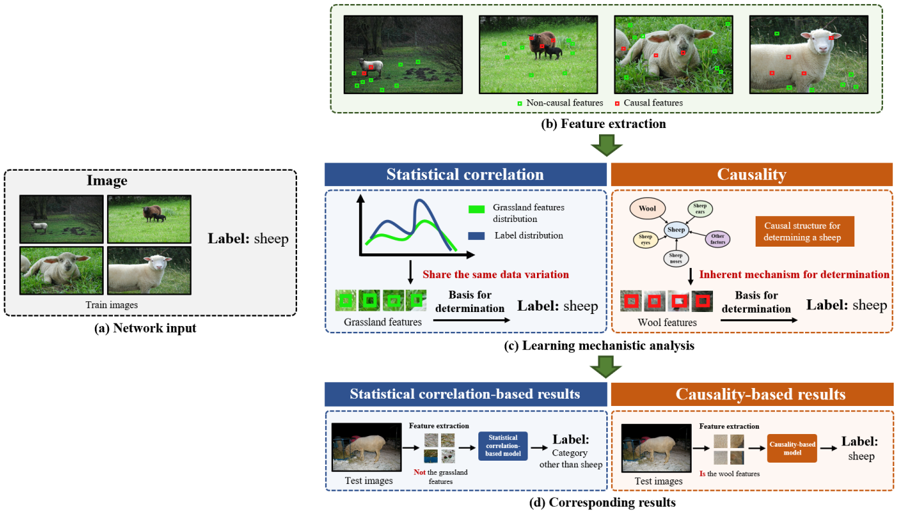
This diagram illustrates a process for sheep classification, comparing a statistical correlation-based approach with a causality-based approach. The process begins with network input (images of sheep and other animals), proceeds through feature extraction and learning mechanistic analysis, and culminates in corresponding results from both approaches.
### Components/Axes
The diagram is divided into four main sections, labeled (a) through (d).
* **(a) Network Input:** Shows a set of training images of sheep and other animals, leading to a "Label: sheep" output.
* **(b) Feature Extraction:** Displays a sequence of images with green boxes indicating "Causal features" and red boxes indicating "Non-causal features".
* **(c) Learning Mechanistic Analysis:** This section is split into two sub-sections: "Statistical correlation" and "Causality".
* **Statistical Correlation:** Includes a graph with a blue line representing "Grassland features distribution" and a green line representing "Label distribution". It also shows a "Basis for determination" labeled "Grassland features" leading to a "Label: sheep" output.
* **Causality:** Depicts a diagram with components labeled "Wool", "Sheep", "Other features", and "Causal structure for determining a sheep". It also shows a "Basis for determination" labeled "Inherent mechanism" leading to a "Label: sheep" output.
* **(d) Corresponding Results:** This section is also split into two sub-sections: "Statistical correlation-based results" and "Causality-based results".
* **Statistical correlation-based results:** Shows test images processed through "Feature extraction" and a "Statistical correlation based model" resulting in a "Label: Category other than sheep".
* **Causality-based results:** Shows test images processed through "Feature extraction" and a "Causality-based model" resulting in a "Label: sheep".
The legend at the bottom-right of section (b) defines the colors: green for "Causal features" and red for "Non-causal features".
### Detailed Analysis or Content Details
* **Section (a):** Four images are shown, two of sheep and two of other animals (possibly cows). The output is consistently labeled "sheep".
* **Section (b):** A sequence of five images is presented. The first image has several red boxes (non-causal features) and a few green boxes (causal features). The subsequent images show a gradual shift towards more green boxes (causal features) and fewer red boxes.
* **Section (c) - Statistical Correlation:** The graph shows two curves. The blue "Grassland features distribution" curve has a peak around the center and then declines. The green "Label distribution" curve is a relatively flat line. The "Basis for determination" is "Grassland features".
* **Section (c) - Causality:** A diagram shows relationships between "Wool", "Sheep", and "Other features". The "Causal structure for determining a sheep" is highlighted. The "Basis for determination" is "Inherent mechanism".
* **Section (d) - Statistical Correlation:** Test images are processed, and the model incorrectly labels the category as "Category other than sheep".
* **Section (d) - Causality:** Test images are processed, and the model correctly labels the category as "sheep".
### Key Observations
* The diagram highlights a contrast between relying on statistical correlation (grassland features) versus causal relationships (wool features) for sheep classification.
* The statistical correlation approach appears to be susceptible to misclassification, as it labels a sheep as "Category other than sheep".
* The causality-based approach successfully classifies the sheep.
* The feature extraction process seems to identify and emphasize causal features over time.
### Interpretation
The diagram demonstrates the importance of identifying causal features for robust classification. The statistical correlation approach, which relies on potentially spurious correlations (like grassland features), is prone to errors. In contrast, the causality-based approach, which focuses on inherent characteristics of sheep (like wool), provides more accurate results. This suggests that understanding the underlying mechanisms driving a classification task is crucial for building reliable models. The shift from red to green boxes in section (b) visually represents the process of identifying and prioritizing causal features. The diagram serves as a visual argument for the benefits of causal inference in machine learning. The two curves in section (c) show that the label distribution is relatively flat, while the grassland features distribution has a peak, suggesting that grassland features alone are not sufficient for accurate classification. The final results in section (d) clearly illustrate the superior performance of the causality-based approach.