## Image Description
### Overview
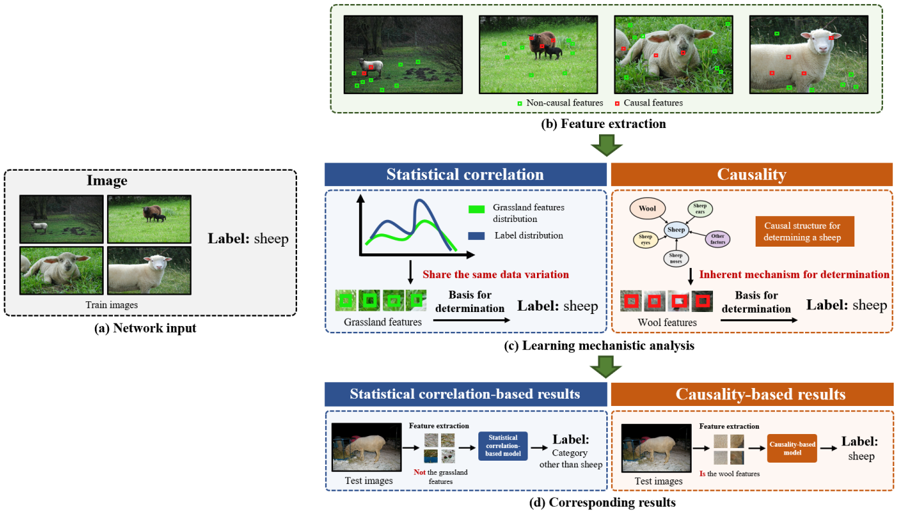
The image is a flowchart illustrating a process for determining the label of an image, specifically for identifying sheep. The flowchart is divided into several sections, each representing a different stage of the process.
### Components/Axes
- **Network Input**: This section shows a series of images labeled "sheep" and "non-sheep" as the input for a network.
- **Feature Extraction**: This section shows images of sheep with green and red annotations indicating non-causal and causal features, respectively.
- **Statistical Correlation**: This section shows a graph with two lines representing statistical correlation between grassland features and label distribution.
- **Causality**: This section shows a diagram with arrows indicating the causal structure for determining a sheep and the inherent mechanism for determination.
- **Learning Mechanism Analysis**: This section shows a flowchart with arrows indicating the learning mechanism analysis based on statistical correlation and causality.
- **Corresponding Results**: This section shows the results of the analysis, with images of sheep and non-sheep and their corresponding labels.
### Detailed Analysis or Content Details
- **Network Input**: The input images are labeled "sheep" and "non-sheep" to train the network.
- **Feature Extraction**: The images of sheep are annotated with green and red features to identify non-causal and causal features.
- **Statistical Correlation**: The graph shows that grassland features have a strong correlation with the label distribution.
- **Causality**: The diagram shows that the causal structure for determining a sheep is based on wool features.
- **Learning Mechanism Analysis**: The flowchart shows that the learning mechanism analysis is based on statistical correlation and causality.
- **Corresponding Results**: The results show that the network was able to correctly label the sheep images based on the causal structure and statistical correlation.
### Key Observations
- The network was able to correctly label the sheep images based on the causal structure and statistical correlation.
- The feature extraction process was able to identify non-causal and causal features in the images.
- The statistical correlation between grassland features and label distribution was strong.
### Interpretation
The data suggests that the network was able to accurately determine the label of an image based on the causal structure and statistical correlation. The feature extraction process was able to identify non-causal and causal features in the images, which helped the network to make accurate predictions. The statistical correlation between grassland features and label distribution was strong, indicating that the network was able to learn from the data and make accurate predictions. The causal structure for determining a sheep was based on wool features, which helped the network to make accurate predictions. Overall, the data suggests that the network was able to accurately determine the label of an image based on the causal structure and statistical correlation.