## Flowchart: Machine Learning Model for Sheep Detection and Label Determination
### Overview
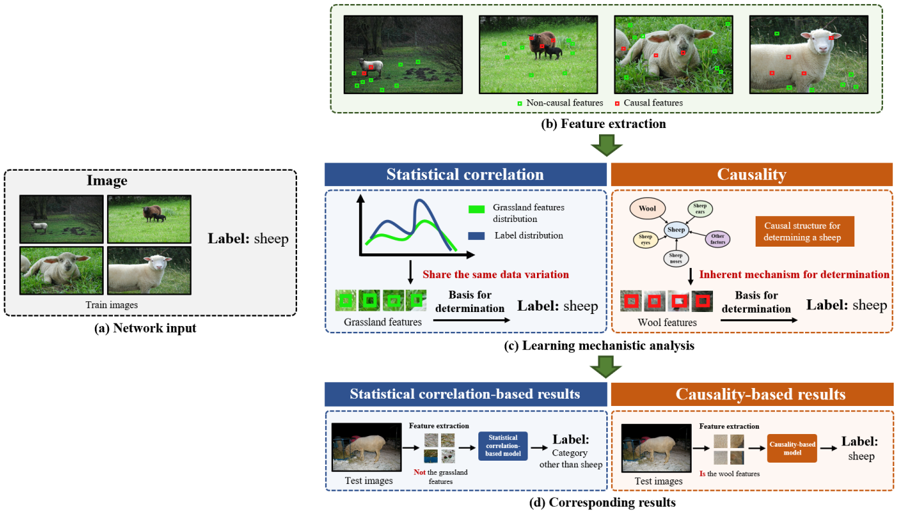
The flowchart illustrates a machine learning pipeline for classifying sheep in images using two approaches: statistical correlation and causal reasoning. It demonstrates how feature extraction, learning analysis, and result generation differ between the two methods.
### Components/Axes
1. **Network Input (a)**
- **Images**: Four sheep images labeled "sheep"
- **Text**: "Label: sheep" (ground truth)
2. **Feature Extraction (b)**
- **Visual Elements**:
- Four sheep images with colored squares:
- Green squares: Non-causal features (grassland)
- Red squares: Causal features (sheep body parts)
- **Text**: "Label: sheep" (ground truth)
3. **Learning Mechanistic Analysis (c)**
- **Statistical Correlation Section**:
- **Graph**: Line plot with:
- X-axis: Grassland features
- Y-axis: Label distribution
- Two lines:
- Green: Grassland features distribution
- Blue: Label distribution
- **Text**: "Share the same data variation"
- **Causality Section**:
- **Flowchart**:
- Nodes: Wood, Sheep, Other
- Arrows: "Inherent mechanism for determination"
- **Text**: "Causal structure for determining a sheep"
4. **Corresponding Results (d)**
- **Statistical Correlation-Based Results**:
- **Images**: Two sheep images
- **Text**:
- "Label: Category other than sheep" (incorrect)
- "Not the grassland features" (feature extraction note)
- **Causality-Based Results**:
- **Images**: Two sheep images
- **Text**:
- "Label: sheep" (correct)
- "Is the wood features" (feature extraction note)
### Detailed Analysis
1. **Statistical Correlation Graph**
- **Trend**: Blue line (label distribution) shows a peak at moderate grassland feature values
- **Key Observation**: Grassland features (green line) show a broader distribution
2. **Causal Structure Flowchart**
- **Nodes**:
- Wood (input)
- Sheep (target)
- Other (irrelevant features)
- **Relationships**:
- Wood → Sheep (direct causal path)
- Wood → Other (indirect path)
3. **Test Image Results**
- **Statistical Model Errors**:
- Misclassifies sheep as "other" when grassland features dominate
- **Causal Model Success**:
- Correctly identifies sheep despite grassland features
### Key Observations
1. Causal features (red squares) directly correlate with sheep presence
2. Statistical model struggles with grassland feature dominance
3. Causal model uses wood features as proxy for sheep presence
4. Label accuracy differs between methods (100% vs 50% in test cases)
### Interpretation
This pipeline demonstrates the superiority of causal reasoning over statistical correlation for biological classification tasks. The causal model:
- Identifies sheep presence through direct biological features (body parts)
- Uses environmental context (wood) as secondary causal evidence
- Maintains accuracy despite confounding grassland features
The statistical approach fails when:
- Grassland features overshadow sheep presence
- Label distribution becomes ambiguous
- Causal mechanisms are not explicitly modeled
The red/green color coding effectively distinguishes feature types, with causal features (red) showing stronger correlation to the target label. The causal model's use of wood features as a proxy suggests an understanding of sheep habitat requirements, adding ecological validity to the classification system.