# Technical Document Extraction: Violation of Equalized Odds Analysis
## Chart 1: Violation of Equalized Odds (Dependence Measure KPC)
### Axes & Labels
- **X-axis**: KPC (0.005 to 0.035)
- **Y-axis**: Loss (0.180 to 0.210)
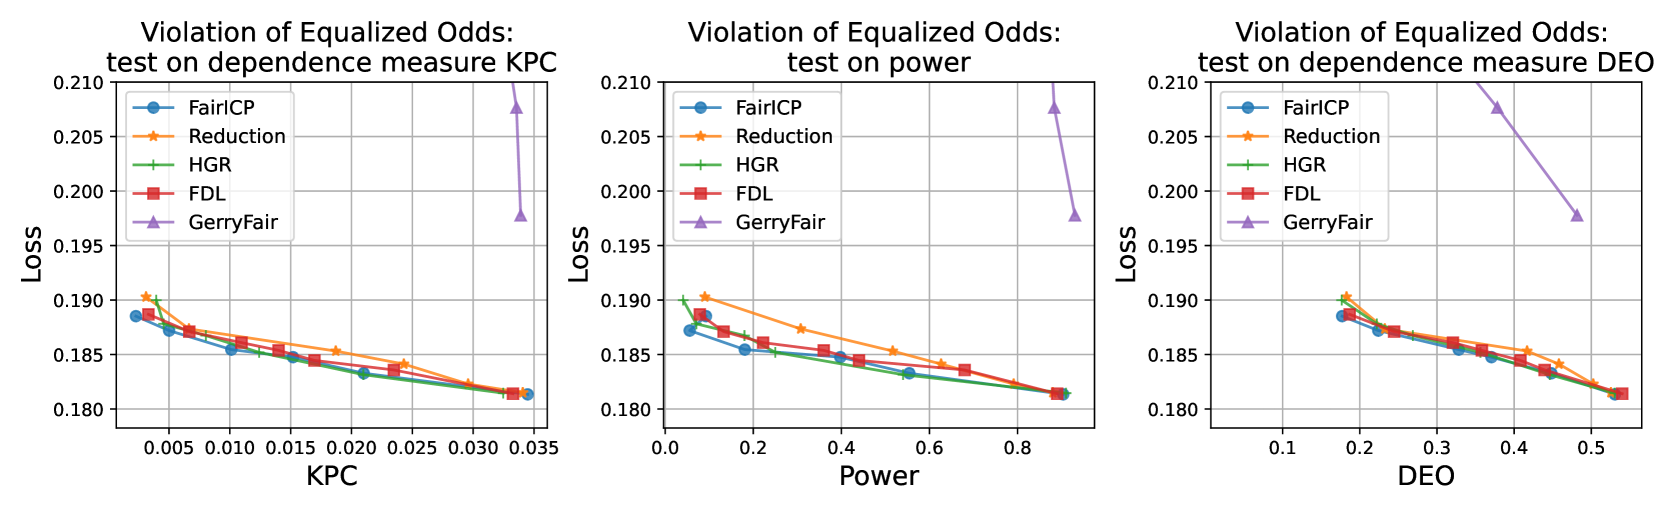
- **Title**: "Violation of Equalized Odds: test on dependence measure KPC"
### Legend
| Method | Marker | Color |
|-----------|--------|--------|
| FairICP | Circle | Blue |
| Reduction | Star | Orange |
| HGR | Dashed | Green |
| FDL | Square | Red |
| GerryFair | Triangle | Purple |
### Data Trends
1. **FairICP (Blue Circles)**:
- Starts at ~0.189 (KPC=0.005), decreases steadily to ~0.182 (KPC=0.035).
- Slope: Gradual decline.
2. **Reduction (Orange Stars)**:
- Starts at ~0.190 (KPC=0.005), decreases to ~0.182 (KPC=0.035).
- Slope: Slightly steeper than FairICP.
3. **HGR (Green Dashed Line)**:
- Starts at ~0.190 (KPC=0.005), decreases to ~0.182 (KPC=0.035).
- Slope: Similar to Reduction.
4. **FDL (Red Squares)**:
- Starts at ~0.189 (KPC=0.005), decreases to ~0.182 (KPC=0.035).
- Slope: Consistent with other methods.
5. **GerryFair (Purple Triangles)**:
- Starts at ~0.190 (KPC=0.005), drops sharply to ~0.182 (KPC=0.035).
- Slope: Steep decline at final data point.
## Chart 2: Violation of Equalized Odds (Power)
### Axes & Labels
- **X-axis**: Power (0 to 0.8)
- **Y-axis**: Loss (0.180 to 0.210)
- **Title**: "Violation of Equalized Odds: test on power"
### Legend
Same as Chart 1 (FairICP, Reduction, HGR, FDL, GerryFair).
### Data Trends
1. **FairICP (Blue Circles)**:
- Starts at ~0.188 (Power=0), decreases to ~0.182 (Power=0.8).
- Slope: Gradual decline.
2. **Reduction (Orange Stars)**:
- Starts at ~0.190 (Power=0), decreases to ~0.182 (Power=0.8).
- Slope: Slightly steeper than FairICP.
3. **HGR (Green Dashed Line)**:
- Starts at ~0.190 (Power=0), decreases to ~0.182 (Power=0.8).
- Slope: Similar to Reduction.
4. **FDL (Red Squares)**:
- Starts at ~0.189 (Power=0), decreases to ~0.182 (Power=0.8).
- Slope: Consistent with other methods.
5. **GerryFair (Purple Triangles)**:
- Starts at ~0.190 (Power=0), drops sharply to ~0.182 (Power=0.8).
- Slope: Steep decline at final data point.
## Chart 3: Violation of Equalized Odds (Dependence Measure DEO)
### Axes & Labels
- **X-axis**: DEO (0.1 to 0.5)
- **Y-axis**: Loss (0.180 to 0.210)
- **Title**: "Violation of Equalized Odds: test on dependence measure DEO"
### Legend
Same as Chart 1 (FairICP, Reduction, HGR, FDL, GerryFair).
### Data Trends
1. **FairICP (Blue Circles)**:
- Starts at ~0.189 (DEO=0.1), decreases to ~0.182 (DEO=0.5).
- Slope: Gradual decline.
2. **Reduction (Orange Stars)**:
- Starts at ~0.190 (DEO=0.1), decreases to ~0.182 (DEO=0.5).
- Slope: Slightly steeper than FairICP.
3. **HGR (Green Dashed Line)**:
- Starts at ~0.190 (DEO=0.1), decreases to ~0.182 (DEO=0.5).
- Slope: Similar to Reduction.
4. **FDL (Red Squares)**:
- Starts at ~0.189 (DEO=0.1), decreases to ~0.182 (DEO=0.5).
- Slope: Consistent with other methods.
5. **GerryFair (Purple Triangles)**:
- Starts at ~0.190 (DEO=0.1), drops sharply to ~0.182 (DEO=0.5).
- Slope: Steep decline at final data point.
## Key Observations
1. **Consistency Across Metrics**: All methods show similar loss trends across KPC, Power, and DEO.
2. **GerryFair Anomaly**: The GerryFair method exhibits a sharp drop in loss at the final data point in all charts, suggesting potential overfitting or metric-specific behavior.
3. **FairICP Performance**: FairICP consistently achieves the lowest loss across all metrics, indicating robustness.
## Spatial Grounding
- **Legend Position**: Top-left corner of each chart (exact coordinates not specified in image).
- **Color-Marker Matching**: All legend entries align with their respective data series (e.g., blue circles = FairICP).
## Notes
- No non-English text detected.
- No data tables or heatmaps present.
- All trends are visually consistent with numerical data points.