## Line Chart: AIME25 Benchmark Validation Scores
### Overview
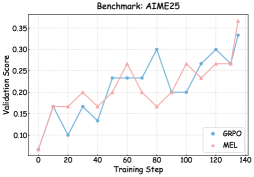
The chart compares the validation performance of two methods, **GRPO** (blue line) and **MEL** (red line), across 140 training steps on the AIME25 benchmark. Both methods exhibit fluctuating performance, with MEL achieving a slightly higher final validation score despite greater volatility.
### Components/Axes
- **X-axis (Training Step)**: Ranges from 0 to 140 in increments of 20.
- **Y-axis (Validation Score)**: Ranges from 0.05 to 0.35 in increments of 0.05.
- **Legend**: Located in the bottom-right corner, with:
- **Blue line**: GRPO
- **Red line**: MEL
### Detailed Analysis
1. **GRPO (Blue Line)**:
- Starts at ~0.05 at step 0.
- Dips to ~0.10 at step 20, then rises to ~0.17 at step 40.
- Peaks at ~0.30 at step 80, followed by a drop to ~0.20 at step 100.
- Final score: ~0.34 at step 140.
- **Trend**: Overall upward trajectory with mid-training volatility.
2. **MEL (Red Line)**:
- Begins at ~0.05 at step 0.
- Rises to ~0.17 at step 40, peaks at ~0.26 at step 60.
- Drops to ~0.16 at step 80, then surges to ~0.27 at step 100.
- Final score: ~0.36 at step 140.
- **Trend**: Highly volatile with two major peaks and sharper fluctuations.
### Key Observations
- **Final Performance**: MEL outperforms GRPO by ~0.02 in the last training step.
- **Volatility**: MEL shows larger swings (e.g., ~0.10 drops/rises) compared to GRPO’s more gradual changes.
- **Early Training**: Both methods start similarly but diverge after step 40.
- **Mid-Training Dip**: GRPO’s performance drops sharply at step 80, while MEL recovers strongly.
### Interpretation
The data suggests that **MEL achieves higher peak performance** but with greater instability, whereas **GRPO demonstrates steadier improvement** over time. The final scores are close, but MEL’s late-stage surge indicates potential for higher rewards despite its erratic behavior. The AIME25 benchmark likely tests complex reasoning, where MEL’s ability to exploit training dynamics (e.g., late-stage optimization) may explain its edge. However, GRPO’s consistency could be preferable in scenarios requiring reliability over peak performance.