\n
## Line Chart: Validation Score vs. Training Step (Benchmark: AIME25)
### Overview
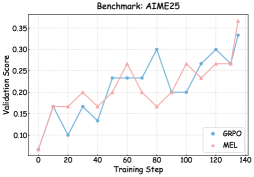
This image presents a line chart illustrating the validation score of two models, GRPO and MEL, as a function of the training step. The chart appears to track the performance of these models during a training process on the AIME25 benchmark.
### Components/Axes
* **Title:** Benchmark: AIME25 (positioned at the top-center)
* **X-axis:** Training Step (ranging from approximately 0 to 140, with markers at intervals of 20)
* **Y-axis:** Validation Score (ranging from approximately 0.10 to 0.35, with markers at intervals of 0.05)
* **Legend:** Located in the bottom-right corner.
* GRPO (represented by a blue line with circular markers)
* MEL (represented by a pink line with triangular markers)
### Detailed Analysis
**GRPO (Blue Line):** The GRPO line generally slopes upward, indicating an increasing validation score with increasing training steps. However, it exhibits significant fluctuations.
* At Training Step 0: Validation Score ≈ 0.13
* At Training Step 20: Validation Score ≈ 0.16
* At Training Step 40: Validation Score ≈ 0.14
* At Training Step 60: Validation Score ≈ 0.24
* At Training Step 80: Validation Score ≈ 0.30
* At Training Step 100: Validation Score ≈ 0.20
* At Training Step 120: Validation Score ≈ 0.28
* At Training Step 140: Validation Score ≈ 0.27
**MEL (Pink Line):** The MEL line also shows an overall upward trend, but with less pronounced fluctuations than GRPO.
* At Training Step 0: Validation Score ≈ 0.10
* At Training Step 20: Validation Score ≈ 0.18
* At Training Step 40: Validation Score ≈ 0.18
* At Training Step 60: Validation Score ≈ 0.25
* At Training Step 80: Validation Score ≈ 0.22
* At Training Step 100: Validation Score ≈ 0.24
* At Training Step 120: Validation Score ≈ 0.26
* At Training Step 140: Validation Score ≈ 0.36
### Key Observations
* Both models demonstrate improvement in validation score as training progresses.
* GRPO exhibits higher volatility in its validation score compared to MEL.
* MEL consistently has a lower validation score than GRPO until approximately Training Step 140, where it surpasses GRPO.
* The largest increase in validation score for GRPO occurs between Training Steps 40 and 60.
* The largest increase in validation score for MEL occurs between Training Steps 120 and 140.
### Interpretation
The chart suggests that both GRPO and MEL are learning from the training data, as evidenced by the increasing validation scores. The higher volatility of GRPO might indicate a more sensitive or unstable training process. The fact that MEL eventually surpasses GRPO in validation score towards the end of the training period suggests that MEL may have a more robust learning algorithm or a better ability to generalize from the data, or that GRPO is overfitting. The AIME25 benchmark appears to be a suitable environment for evaluating these models, as it allows for differentiation in performance. The fluctuations in both lines could be due to the stochastic nature of the training process, the batch size used, or the learning rate schedule. Further investigation would be needed to determine the root cause of these fluctuations and to optimize the training process for both models.