## Violin Plot: Ibdula
### Overview
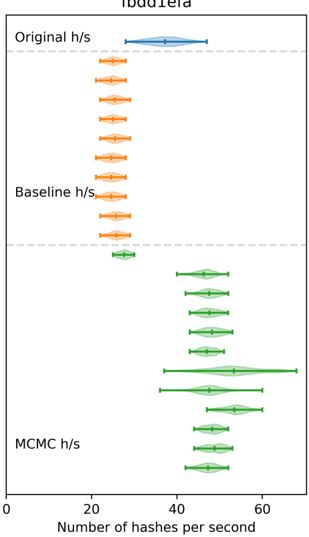
The image is a violin plot comparing the distribution of "Number of hashes per second" for three different methods: "Original h/s", "Baseline h/s", and "MCMC h/s". Each method has multiple data points represented as a violin plot, showing the distribution of hash rates.
### Components/Axes
* **Title:** Ibdula
* **Y-axis:** Categorical labels indicating the method used: "Original h/s", "Baseline h/s", and "MCMC h/s". Each category has multiple data points.
* **X-axis:** "Number of hashes per second", ranging from 0 to 60. Axis markers are present at 0, 20, 40, and 60.
* **Horizontal dashed lines:** Two horizontal dashed lines separate the three categories.
* **Violin Plots:** Each data series is represented by a violin plot, showing the distribution of data points for each method.
* "Original h/s" is represented in blue.
* "Baseline h/s" is represented in orange.
* "MCMC h/s" is represented in green.
### Detailed Analysis
* **Original h/s (Blue):**
* The "Original h/s" violin plot is located at the top of the chart.
* The distribution is centered around 40 hashes per second, with a spread from approximately 35 to 45 hashes per second.
* **Baseline h/s (Orange):**
* The "Baseline h/s" violin plots are located in the middle of the chart. There are 8 violin plots.
* The distributions are centered around 25 hashes per second, with a spread from approximately 20 to 30 hashes per second.
* **MCMC h/s (Green):**
* The "MCMC h/s" violin plots are located at the bottom of the chart. There are 8 violin plots.
* The distributions vary, with some centered around 40 hashes per second and others around 50 hashes per second. One violin plot has a wider spread, ranging from approximately 35 to 65 hashes per second.
### Key Observations
* The "Original h/s" method has a higher hash rate compared to the "Baseline h/s" method.
* The "MCMC h/s" method shows a wider range of hash rates, with some instances performing better than the "Original h/s" method and others performing similarly or worse.
* The "Baseline h/s" method consistently shows the lowest hash rates.
### Interpretation
The violin plot provides a visual comparison of the hash rates achieved by three different methods. The "Original h/s" method serves as a benchmark, while the "Baseline h/s" method appears to underperform. The "MCMC h/s" method shows potential for improvement, but its performance is inconsistent. The wide distribution of "MCMC h/s" suggests that its performance may be highly dependent on specific parameters or conditions. The data suggests that the MCMC method can, in some cases, outperform the original method, but it is not consistently better.