## Horizontal Box Plot: Hash Rate Comparison
### Overview
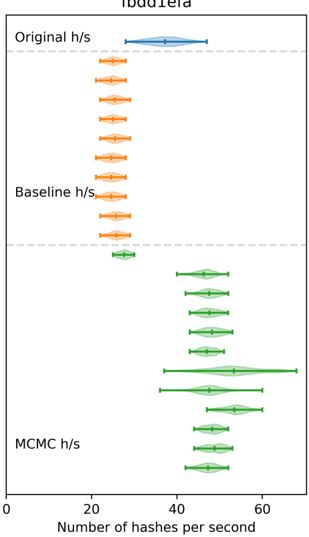
The image displays a horizontal box plot (or violin plot) comparing the distribution of hash rates, measured in "Number of hashes per second," across three different methods or datasets labeled "Original h/s," "Baseline h/s," and "MCMC h/s." The chart is oriented with the categorical variables on the vertical axis and the numerical performance metric on the horizontal axis.
### Components/Axes
* **Title:** "Ibad1era" (This appears at the top center. The spelling is ambiguous and may be a truncated or specific technical term).
* **Y-Axis (Categorical):** Lists three distinct categories, separated by dashed horizontal lines.
1. **Top Category:** "Original h/s"
2. **Middle Category:** "Baseline h/s"
3. **Bottom Category:** "MCMC h/s"
* **X-Axis (Numerical):** Labeled "Number of hashes per second." The axis has major tick marks and labels at **0, 20, 40, and 60**.
* **Data Representation:** Each category contains multiple individual data series, visualized as horizontal box-and-whisker plots or narrow violin plots. Each series consists of:
* A central dot (likely the median or mean).
* A horizontal line or narrow shaded area (likely the interquartile range or a density estimate).
* Whiskers extending horizontally (likely showing the range or a confidence interval).
* **Color Legend (Implicit):** The colors are consistently mapped to the y-axis categories:
* **Blue:** Associated with "Original h/s".
* **Orange:** Associated with "Baseline h/s".
* **Green:** Associated with "MCMC h/s".
### Detailed Analysis
**1. "Original h/s" (Top, Blue):**
* **Visual Trend:** A single, tight cluster with very low variance.
* **Data Points:** The distribution is centered approximately at **32 hashes per second**. The entire range (whiskers) spans roughly from **28 to 36 h/s**. This is the most consistent but not the highest-performing group.
**2. "Baseline h/s" (Middle, Orange):**
* **Visual Trend:** A vertical stack of approximately 10-12 very similar, tightly clustered distributions. Each individual cluster shows low variance.
* **Data Points:** All clusters are centered in a narrow band between approximately **22 and 28 hashes per second**. The overall range for this entire category is from about **20 to 30 h/s**. This method shows consistent but lower performance compared to the others.
**3. "MCMC h/s" (Bottom, Green):**
* **Visual Trend:** A vertical stack of approximately 8-10 distributions that show significantly higher variance and a wider spread of central values compared to the other categories.
* **Data Points:** The central values (dots) for these distributions range from approximately **42 to 58 hashes per second**. The whiskers for individual series show wide ranges; for example, one series spans from about **38 to 62 h/s**, and another from **45 to 55 h/s**. This category demonstrates the highest potential performance but with the greatest inconsistency.
### Key Observations
1. **Performance Hierarchy:** There is a clear separation in performance tiers. "MCMC h/s" operates at a significantly higher hash rate (40-60+ h/s) than both "Original" (~32 h/s) and "Baseline" (20-30 h/s).
2. **Variance Contrast:** "Original h/s" has the lowest variance (tightest cluster). "Baseline h/s" shows low variance within each of its many sub-clusters. "MCMC h/s" exhibits the highest variance both within individual series and across its different sub-clusters.
3. **Structural Pattern:** The "Baseline" and "MCMC" categories are not single distributions but appear to be collections of multiple independent runs or sub-experiments, each plotted as a separate box/violin. The "Original" appears to be a single, consolidated result.
4. **Potential Outlier:** One of the green "MCMC" distributions near the bottom of its group has a central value near **58 h/s** and an upper whisker extending past **60 h/s**, representing the highest observed performance in the chart.
### Interpretation
This chart likely compares the performance of different algorithms or configurations for a hashing task (e.g., in cryptography, blockchain, or password cracking). The "MCMC" (Markov Chain Monte Carlo) method achieves substantially higher throughput (hashes per second) than the "Baseline" and "Original" methods, suggesting it is a more efficient or optimized approach for this specific task.
However, the high variance in the MCMC results indicates that its performance is less predictable and may be sensitive to initial conditions, random seeds, or specific parameters. The "Baseline" method, while slower, offers very consistent and reproducible results across many runs. The "Original" method sits in the middle, offering a balance of moderate speed and high consistency.
The visualization effectively argues that while MCMC can yield superior performance, it comes at the cost of stability. A user might choose MCMC for maximum speed in scenarios where variability is acceptable, or prefer the Baseline for guaranteed, predictable performance. The chart's design, stacking multiple runs vertically within each category, brilliantly emphasizes the distribution and consistency (or lack thereof) for each method, which is more informative than simply plotting average values.