## Line Chart: Hashing Performance Comparison (Ibddiera)
### Overview
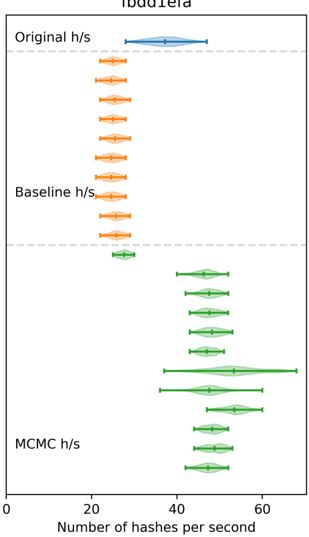
The chart compares hashing performance across three methods (Original, Baseline, MCMC) using error-bounded data points. The x-axis represents "Number of hashes per second," while the y-axis categorizes the methods. Each method's performance is visualized with colored markers and error bars, showing variability and central tendency.
### Components/Axes
- **X-axis**: "Number of hashes per second" (0–60 range, linear scale).
- **Y-axis**: Three categories:
- **Original h/s** (top, blue)
- **Baseline h/s** (middle, orange)
- **MCMC h/s** (bottom, green)
- **Legend**: Located at the top, mapping colors to methods:
- Blue = Original h/s
- Orange = Baseline h/s
- Green = MCMC h/s
### Detailed Analysis
1. **Original h/s** (Blue):
- Single data point at ~30 hashes/s.
- Error bar spans ±2 hashes/s (28–32 range).
- Positioned near the top of the y-axis.
2. **Baseline h/s** (Orange):
- 10 data points clustered tightly between 20–25 hashes/s.
- Error bars average ±1.5 hashes/s (e.g., 21–23 for lower points, 23–25 for upper points).
- Consistent spread with minimal variability.
3. **MCMC h/s** (Green):
- 10 data points spanning 30–60 hashes/s.
- Error bars vary widely (e.g., ±3 for lower points, ±8 for upper points).
- Notable outliers: Two points at ~50–60 hashes/s with large error margins.
### Key Observations
- **MCMC h/s** exhibits the highest hashing rates but with significant variability (wide error bars).
- **Baseline h/s** shows the lowest and most stable performance.
- **Original h/s** falls between the two, with moderate performance and low variability.
- The spread in MCMC h/s suggests potential trade-offs between speed and consistency.
### Interpretation
The data implies that MCMC h/s may optimize for higher throughput but at the cost of reliability, as evidenced by its wide error margins. Baseline h/s appears optimized for stability, while Original h/s represents a middle ground. The single Original h/s data point might indicate a reference or outlier measurement. The chart highlights a potential design choice: prioritizing speed (MCMC) vs. consistency (Baseline). Further investigation into MCMC's error sources (e.g., computational overhead, algorithmic variability) could clarify its suitability for specific use cases.