## Line Graphs: Success Rate vs. Final Correlation by Dataset Size (d)
### Overview
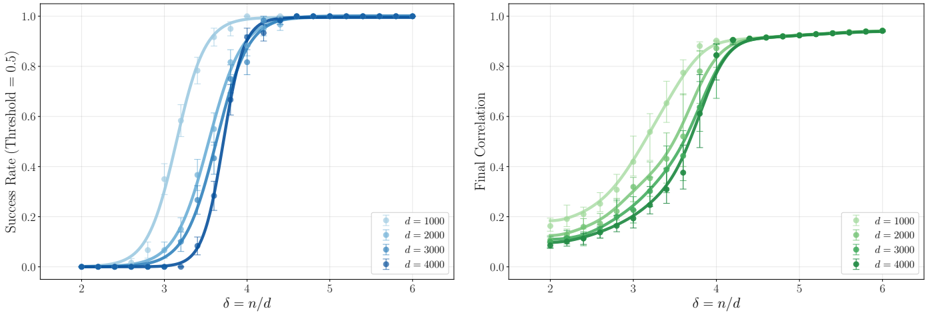
The image contains two side-by-side line graphs comparing performance metrics (success rate and final correlation) across different dataset sizes (d = 1000, 2000, 3000, 4000). Both graphs plot metrics against δ = n/d, where n/d represents a normalized parameter. The left graph focuses on success rate (threshold = 0.5), while the right graph measures final correlation. Data points are plotted with markers and connected by lines, with error bars indicating variability.
---
### Components/Axes
- **Left Graph (Success Rate)**:
- **X-axis**: δ = n/d (ranges from 2 to 6)
- **Y-axis**: Success Rate (Threshold = 0.5) (ranges from 0.0 to 1.0)
- **Legend**: Located in the top-right corner, with colors corresponding to d values:
- Light blue: d = 1000
- Medium blue: d = 2000
- Dark blue: d = 3000
- Very dark blue: d = 4000
- **Markers**: Circular data points with error bars.
- **Right Graph (Final Correlation)**:
- **X-axis**: δ = n/d (ranges from 2 to 6)
- **Y-axis**: Final Correlation (ranges from 0.0 to 1.0)
- **Legend**: Located in the top-right corner, with colors corresponding to d values:
- Light green: d = 1000
- Medium green: d = 2000
- Dark green: d = 3000
- Very dark green: d = 4000
- **Markers**: Square data points with error bars.
---
### Detailed Analysis
#### Left Graph (Success Rate)
- **Trends**:
- All d values show a sigmoidal increase in success rate as δ increases.
- Success rate plateaus near 1.0 for δ ≥ 4.5 across all d values.
- Lower d values (e.g., d = 1000) achieve plateau later than higher d values (e.g., d = 4000).
- Error bars are smallest for d = 4000, indicating higher precision in larger datasets.
- **Key Data Points**:
- At δ = 3.0:
- d = 1000: ~0.65
- d = 2000: ~0.70
- d = 3000: ~0.75
- d = 4000: ~0.80
- At δ = 4.0:
- All d values exceed 0.90, with d = 4000 reaching ~0.95.
#### Right Graph (Final Correlation)
- **Trends**:
- All d values show a gradual increase in final correlation as δ increases.
- Correlation plateaus near 0.95 for δ ≥ 4.5 across all d values.
- Lower d values (e.g., d = 1000) achieve plateau later than higher d values (e.g., d = 4000).
- Error bars are smallest for d = 4000, indicating higher precision in larger datasets.
- **Key Data Points**:
- At δ = 3.0:
- d = 1000: ~0.30
- d = 2000: ~0.35
- d = 3000: ~0.40
- d = 4000: ~0.45
- At δ = 4.0:
- All d values exceed 0.70, with d = 4000 reaching ~0.85.
---
### Key Observations
1. **Dataset Size Impact**: Larger datasets (higher d) consistently outperform smaller datasets in both success rate and final correlation across all δ values.
2. **Threshold Behavior**: The success rate threshold of 0.5 is surpassed rapidly for δ ≥ 3.0, with larger datasets achieving it earlier.
3. **Diminishing Returns**: Both metrics plateau at high δ values, suggesting limited gains beyond δ = 4.5.
4. **Error Bars**: Smaller error bars for larger d values indicate more reliable measurements in bigger datasets.
---
### Interpretation
The data demonstrates that increasing dataset size (d) improves both success rate and final correlation, particularly at lower δ values. This suggests that larger datasets enhance model robustness or generalization. The threshold of 0.5 in the success rate graph may represent a critical operational benchmark, where larger datasets achieve this threshold more efficiently. The plateauing trends imply that beyond a certain δ (n/d), additional data provides diminishing returns. The consistent performance across d values highlights the importance of dataset size in optimizing these metrics, with practical implications for resource allocation in data-driven systems.