## Line Chart: Calling Error Rate vs. Training Steps
### Overview
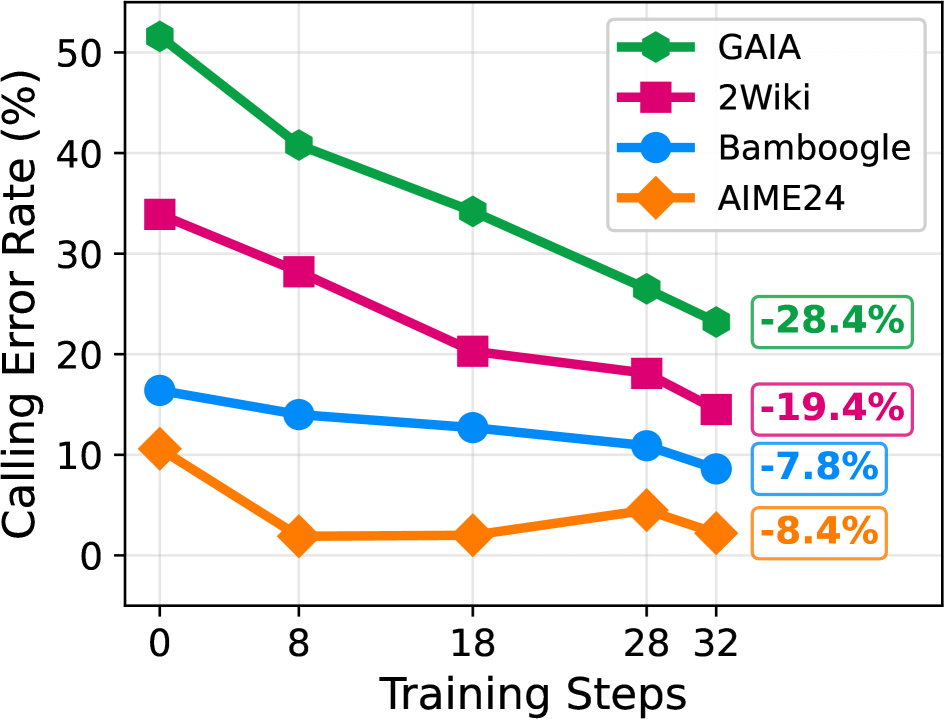
This line chart depicts the relationship between the calling error rate (in percentage) and the number of training steps for four different models: GAIA, 2Wiki, Bambooogle, and AIME24. The chart shows how the error rate changes as the models are trained further. The error rates are shown as lines plotted against the training steps. Final error rates are highlighted with boxes.
### Components/Axes
* **X-axis:** Training Steps (ranging from 0 to 32, with markers at 0, 8, 18, 28, and 32)
* **Y-axis:** Calling Error Rate (%) (ranging from 0 to 50, with markers at 0, 10, 20, 30, 40, and 50)
* **Legend:** Located in the top-right corner, identifying each line with a color and model name:
* GAIA (Green)
* 2Wiki (Magenta)
* Bambooogle (Blue)
* AIME24 (Orange)
### Detailed Analysis
* **GAIA (Green):** The green line slopes downward, indicating a decreasing error rate with increasing training steps.
* At 0 training steps: approximately 51%
* At 8 training steps: approximately 41%
* At 18 training steps: approximately 33%
* At 28 training steps: approximately 26%
* At 32 training steps: approximately 23% (Highlighted as -28.4%)
* **2Wiki (Magenta):** The magenta line also slopes downward, but less steeply than the GAIA line.
* At 0 training steps: approximately 34%
* At 8 training steps: approximately 28%
* At 18 training steps: approximately 21%
* At 28 training steps: approximately 18%
* At 32 training steps: approximately 15% (Highlighted as -19.4%)
* **Bambooogle (Blue):** The blue line shows a relatively stable error rate, with a slight downward trend.
* At 0 training steps: approximately 16%
* At 8 training steps: approximately 14%
* At 18 training steps: approximately 13%
* At 28 training steps: approximately 11%
* At 32 training steps: approximately 10% (Highlighted as -7.8%)
* **AIME24 (Orange):** The orange line initially decreases rapidly, then plateaus.
* At 0 training steps: approximately 9%
* At 8 training steps: approximately 4%
* At 18 training steps: approximately 3%
* At 28 training steps: approximately 5%
* At 32 training steps: approximately 4% (Highlighted as -8.4%)
### Key Observations
* GAIA exhibits the largest reduction in error rate over the training steps.
* AIME24 reaches a low error rate quickly and then stabilizes.
* Bambooogle shows the smallest change in error rate throughout the training process.
* 2Wiki shows a consistent, but moderate, decrease in error rate.
* All models demonstrate a decreasing error rate with increased training steps, suggesting that further training generally improves performance.
### Interpretation
The chart demonstrates the effectiveness of training on the calling error rate for each of the four models. The significant reduction in error rate for GAIA suggests it benefits most from increased training. AIME24, on the other hand, appears to converge quickly, indicating it may reach a performance limit with relatively few training steps. Bambooogle's stable error rate suggests it may have already reached a good level of performance or requires a different training approach. The consistent decrease in 2Wiki's error rate indicates that continued training is beneficial, but it may require more steps than GAIA to achieve similar results. The highlighted percentage changes at the final training step (32) provide a concise summary of the overall improvement for each model. The data suggests that the optimal training strategy may vary depending on the specific model being used.