## Line Graph: Calling Error Rate vs Training Steps
### Overview
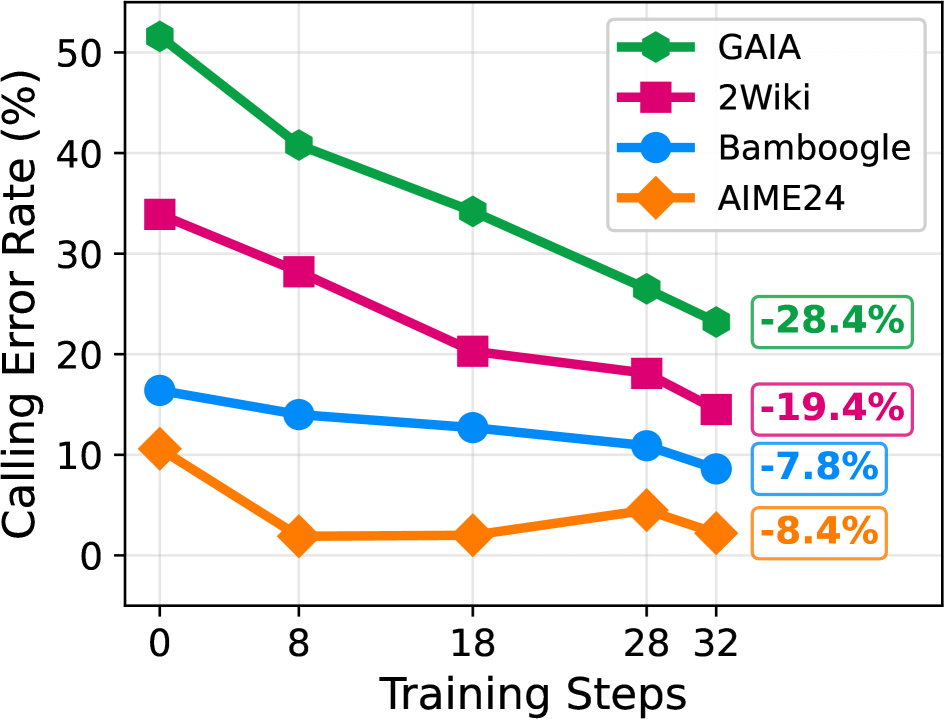
The graph displays the relationship between training steps (x-axis) and calling error rate (y-axis, in percentage) for four AI models: GAIA, 2Wiki, Bamboogle, and AIME24. Each model is represented by a distinct colored line with unique markers. The graph shows a clear downward trend for all models, indicating reduced error rates with increased training.
### Components/Axes
- **X-axis (Training Steps)**: Labeled "Training Steps" with markers at 0, 8, 18, 28, and 32.
- **Y-axis (Calling Error Rate)**: Labeled "Calling Error Rate (%)" with increments from 0 to 50%.
- **Legend**: Located in the top-right corner, mapping:
- Green hexagons → GAIA
- Pink squares → 2Wiki
- Blue circles → Bamboogle
- Orange diamonds → AIME24
- **Data Points**: Each line includes a final percentage change in a box at the end (e.g., "-28.4%" for GAIA).
### Detailed Analysis
1. **GAIA (Green Hexagons)**:
- Starts at ~50% error rate at 0 steps.
- Declines steadily to ~22% at 32 steps.
- Final change: **-28.4%** (largest reduction).
2. **2Wiki (Pink Squares)**:
- Begins at ~35% error rate.
- Drops to ~15% at 32 steps.
- Final change: **-19.4%**.
3. **Bamboogle (Blue Circles)**:
- Starts at ~15% error rate.
- Decreases to ~9% at 32 steps.
- Final change: **-7.8%**.
4. **AIME24 (Orange Diamonds)**:
- Begins at ~10% error rate.
- Dips to ~2% at 18 steps, then fluctuates slightly.
- Final change: **-8.4%**.
### Key Observations
- All models show **consistent improvement** with more training steps.
- **GAIA** demonstrates the **most significant error reduction** (-28.4%).
- **AIME24** has the **smallest overall improvement** (-8.4%) but shows volatility in later steps.
- **2Wiki** and **Bamboogle** exhibit steady declines without major fluctuations.
### Interpretation
The data suggests that **training duration directly impacts error rate reduction**, with GAIA benefiting most from extended training. The negative percentage changes confirm that longer training correlates with improved performance across all models. However, the diminishing returns for AIME24 (e.g., error rate stabilizing after 18 steps) may indicate **plateaus in learning efficiency** or **data saturation**. The stark contrast between GAIA’s steep decline and AIME24’s modest improvement highlights potential differences in **model architecture**, **training algorithms**, or **data utilization strategies**. These trends could inform resource allocation for model optimization in real-world applications.