## Chart: Logarithmic Plot of Calls vs. Clause-to-Variable Ratio
### Overview
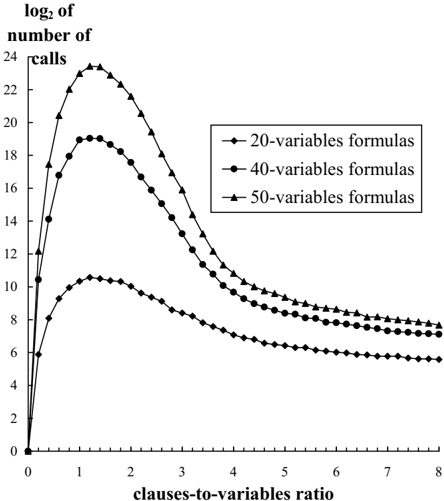
The image is a line chart comparing the logarithmic number of calls (base 2) against the clauses-to-variables ratio for formulas with 20, 40, and 50 variables. The chart illustrates how the number of calls changes as the ratio of clauses to variables increases for each formula type.
### Components/Axes
* **Y-axis:** "log2 of number of calls". The scale ranges from 0 to 24, with tick marks at every increment of 2.
* **X-axis:** "clauses-to-variables ratio". The scale ranges from 0 to 8, with tick marks at every increment of 1.
* **Legend:** Located in the top-right corner of the chart.
* Black line with diamond markers: "20-variables formulas"
* Black line with circle markers: "40-variables formulas"
* Black line with triangle markers: "50-variables formulas"
### Detailed Analysis
* **20-variables formulas (Black line with diamond markers):**
* The line starts at approximately 0 when the clauses-to-variables ratio is 0.
* The line increases to a peak of approximately 10.5 at a ratio of around 1.
* The line then decreases, stabilizing at approximately 6.5 when the ratio is 8.
* **40-variables formulas (Black line with circle markers):**
* The line starts at approximately 0 when the clauses-to-variables ratio is 0.
* The line increases to a peak of approximately 19 at a ratio of around 1.5.
* The line then decreases, stabilizing at approximately 8 when the ratio is 8.
* **50-variables formulas (Black line with triangle markers):**
* The line starts at approximately 0 when the clauses-to-variables ratio is 0.
* The line increases to a peak of approximately 23 at a ratio of around 1.5.
* The line then decreases, stabilizing at approximately 9 when the ratio is 8.
### Key Observations
* All three lines start at the origin (0,0).
* Each line exhibits a peak, indicating a maximum number of calls at a specific clauses-to-variables ratio.
* The peak number of calls increases as the number of variables in the formula increases.
* After reaching their peaks, all lines decrease and appear to converge towards a stable value as the clauses-to-variables ratio increases.
* The peak for the 20-variable formula occurs at a lower clauses-to-variables ratio than the peaks for the 40 and 50-variable formulas.
### Interpretation
The chart suggests that the number of calls required to solve a formula initially increases with the clauses-to-variables ratio, reaching a maximum before decreasing and stabilizing. The peak number of calls is higher for formulas with more variables. This indicates that more complex formulas (with more variables) require more calls to solve, especially around a critical clauses-to-variables ratio. The convergence of the lines at higher ratios suggests that the impact of the number of variables diminishes as the formula becomes heavily constrained. The location of the peak may indicate an "easier-harder-easier" transition, where the problem is easiest to solve at the extremes of the clauses-to-variables ratio.