## Line Chart: Log of Number of Calls vs. Clauses-to-Variables Ratio
### Overview
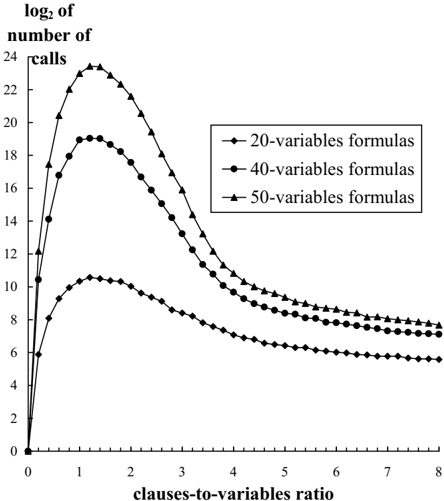
The image is a line chart depicting the logarithmic relationship between the "clauses-to-variables ratio" (x-axis) and the "log of number of calls" (y-axis). Three data series are plotted, representing formulas with 20, 40, and 50 variables. The chart shows how the log of calls changes as the clauses-to-variables ratio increases, with distinct trends for each variable count.
### Components/Axes
- **Title**: "log of number of calls" (top center).
- **X-axis**: "clauses-to-variables ratio" (horizontal), scaled from 0 to 8 in increments of 1.
- **Y-axis**: "log of number of calls" (vertical), scaled from 0 to 24 in increments of 2.
- **Legend**: Located in the top-right corner, with three entries:
- **20-variables formulas**: Black line with diamond markers.
- **40-variables formulas**: Dark gray line with square markers.
- **50-variables formulas**: Light gray line with star markers.
### Detailed Analysis
1. **20-variables formulas (Black, Diamonds)**:
- Peaks at approximately **x = 2** (clauses-to-variables ratio) with a y-value of **~22**.
- Declines sharply after x = 2, reaching ~8 at x = 8.
- Initial rise is steep, with a plateau between x = 0 and x = 1.
2. **40-variables formulas (Dark Gray, Squares)**:
- Peaks at approximately **x = 1.5** with a y-value of **~18**.
- Declines more gradually than the 20-variable series, reaching ~6 at x = 8.
- Initial rise is less steep than the 20-variable series.
3. **50-variables formulas (Light Gray, Stars)**:
- Peaks at approximately **x = 1** with a y-value of **~16**.
- Declines steadily, reaching ~4 at x = 8.
- Initial rise is the least steep among the three series.
### Key Observations
- **Peak Shifts**: Higher variable counts (50 > 40 > 20) peak at lower clauses-to-variables ratios (1 < 1.5 < 2).
- **Logarithmic Decay**: All series exhibit a logarithmic decay after their respective peaks, with steeper declines for lower variable counts.
- **Ordering**: The 20-variable series consistently has the highest y-values across all x-values, followed by 40 and 50 variables.
### Interpretation
The data suggests that formulas with fewer variables (20) generate a higher log of calls at higher clauses-to-variables ratios compared to formulas with more variables (40, 50). This could indicate that simpler formulas (fewer variables) are more "active" or require more clauses to trigger calls, while complex formulas (more variables) reach their maximum efficiency at lower ratios. The logarithmic scale on the y-axis emphasizes the relative differences in call rates, highlighting that the 20-variable series dominates in magnitude. The trends may reflect computational or structural properties of the formulas, such as sensitivity to clause density or variable interactions.