# Technical Analysis of Expert Load Heatmaps
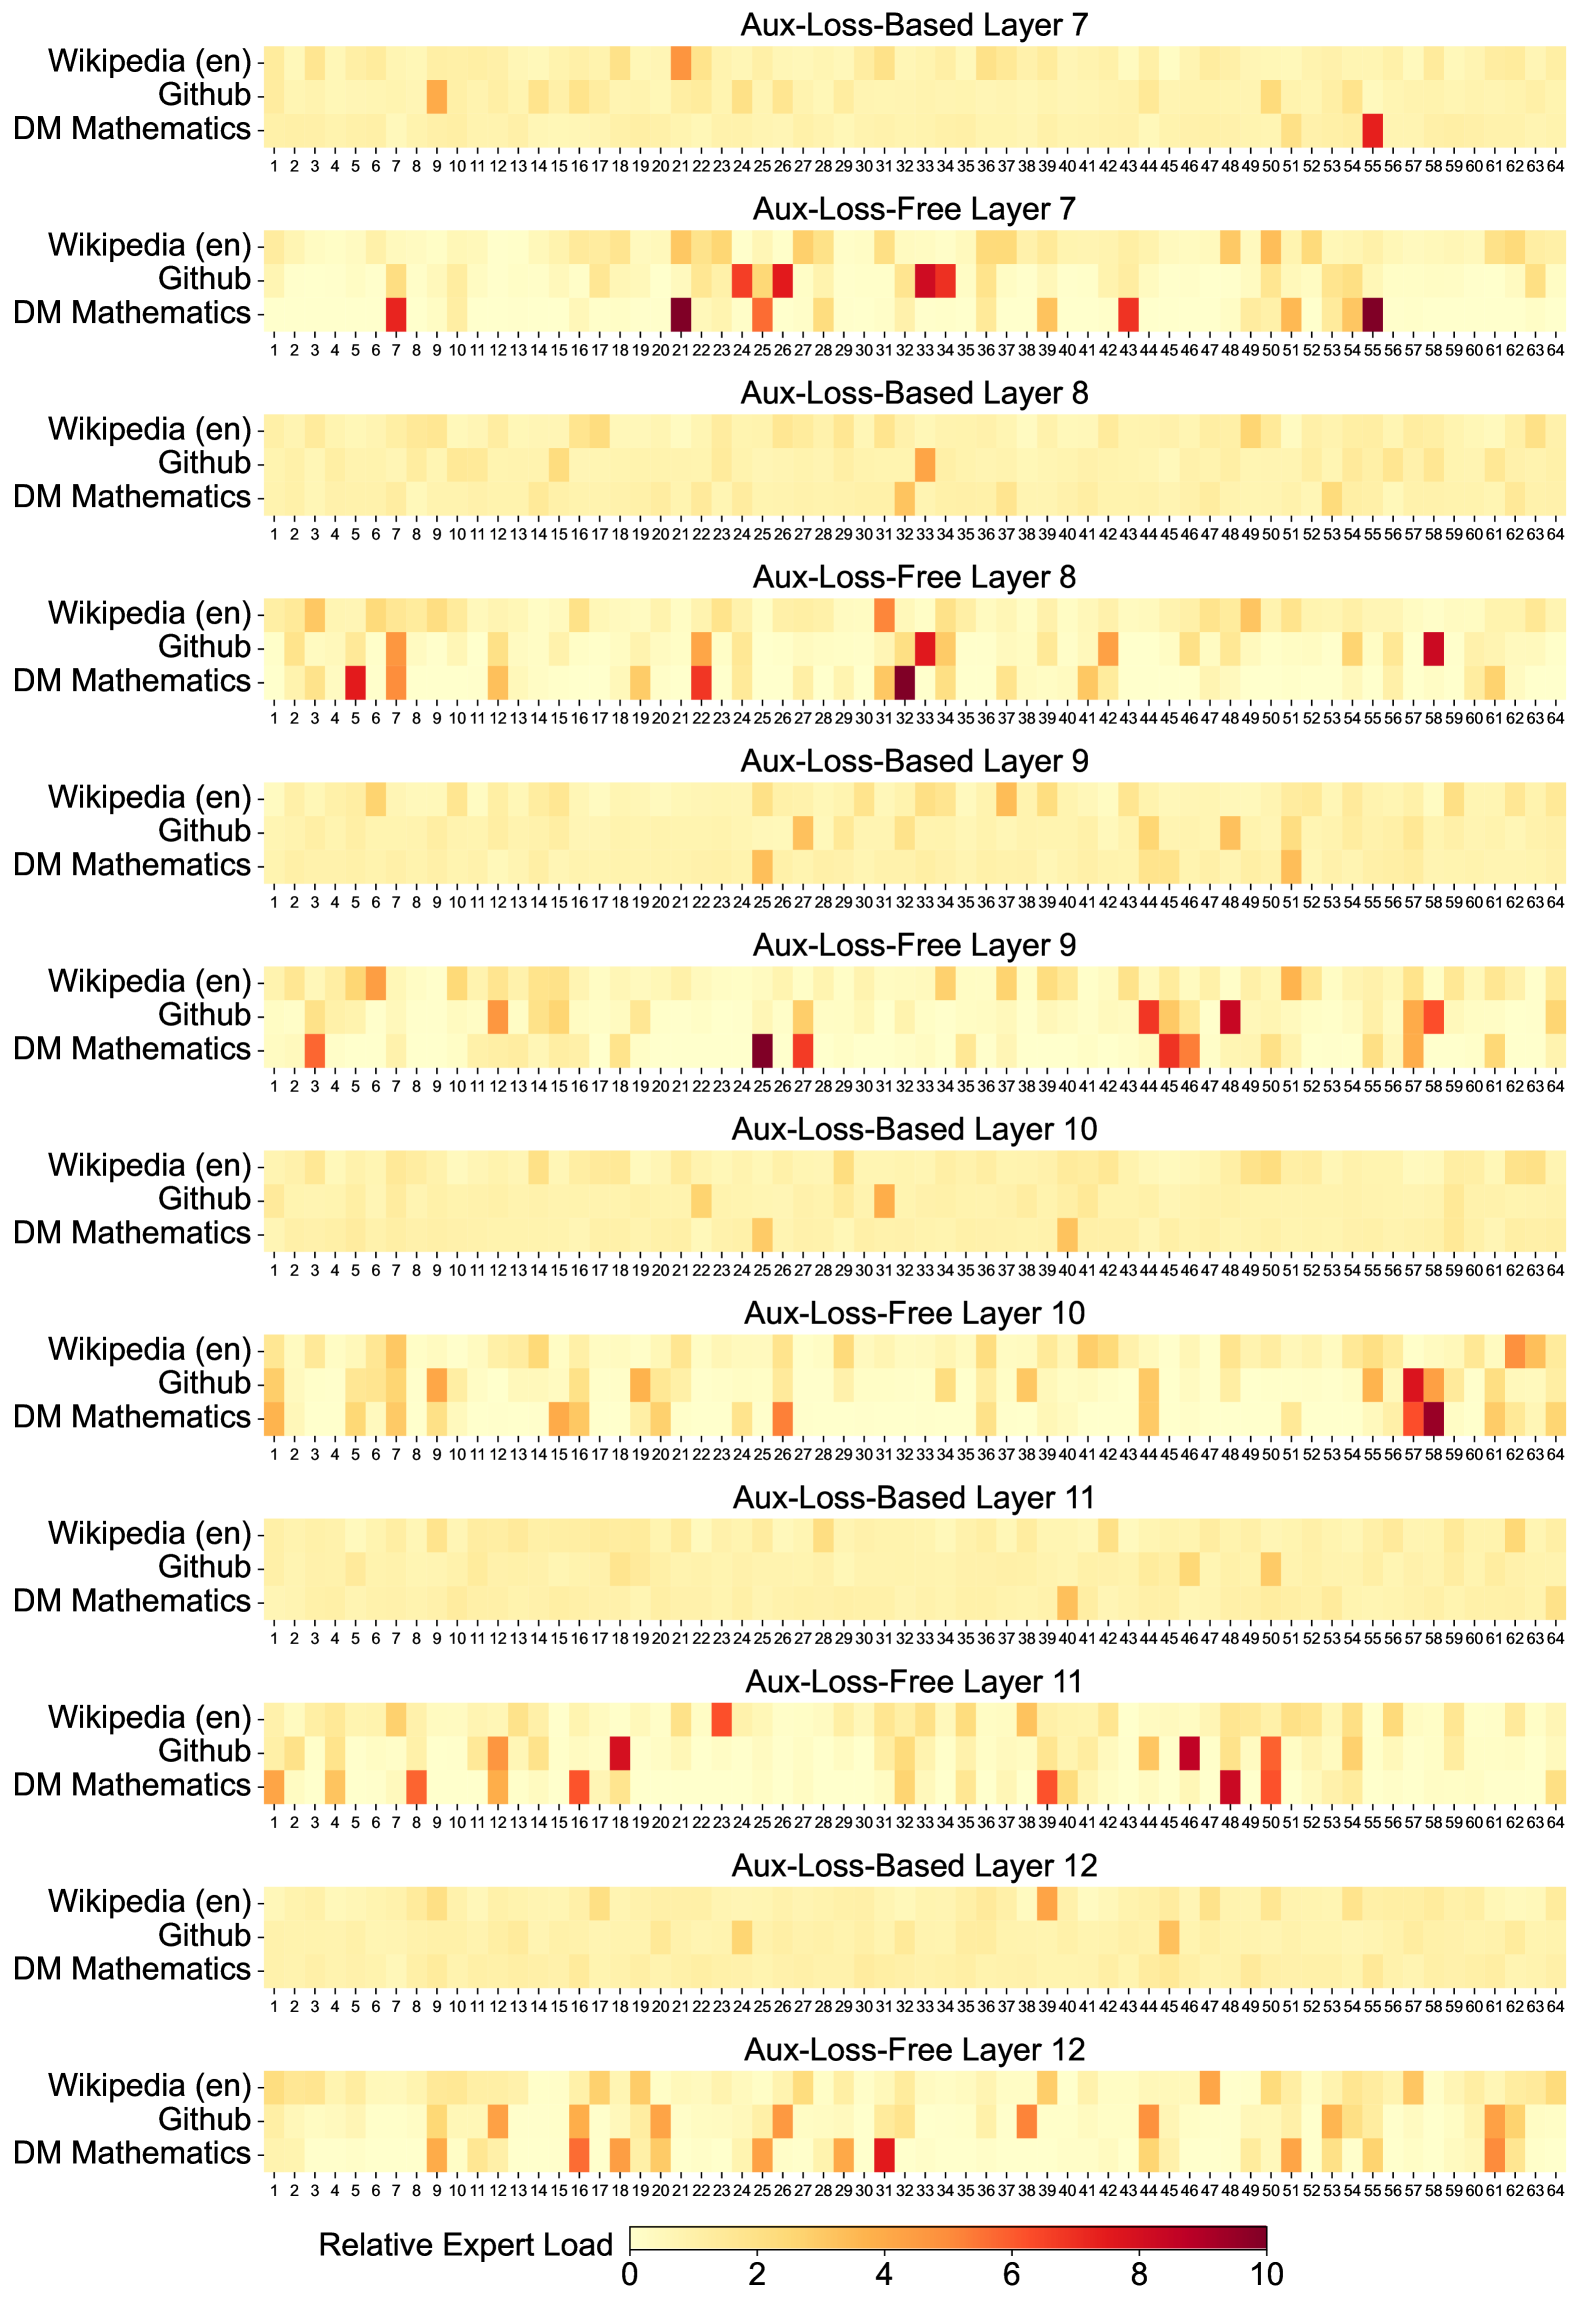
This document provides a comprehensive extraction and analysis of the provided image, which contains 12 heatmaps illustrating the "Relative Expert Load" across different layers and training methodologies of a Mixture-of-Experts (MoE) model.
## 1. General Metadata and Structure
* **Image Type:** A series of 12 vertically stacked heatmaps.
* **Primary Language:** English.
* **Core Metric:** **Relative Expert Load**.
* **Scale:** 0 to 10 (indicated by a color bar at the bottom).
* **Light Yellow (0):** Low load/utilization.
* **Dark Red (10):** High load/utilization.
* **Dimensions per Heatmap:**
* **Y-Axis (Categories):** 3 data sources: `Wikipedia (en)`, `Github`, and `DM Mathematics`.
* **X-Axis (Experts):** 64 individual experts, labeled 1 through 64.
## 2. Component Isolation: Heatmap Grid
The image is organized into pairs of heatmaps for Layers 7 through 12. Each pair compares an **"Aux-Loss-Based"** approach with an **"Aux-Loss-Free"** approach.
### Layer 7
* **Aux-Loss-Based Layer 7:** Shows a relatively uniform, low-intensity distribution (mostly light yellow). Notable slight increases in load for `Wikipedia (en)` at Expert 21 and `DM Mathematics` at Expert 55.
* **Aux-Loss-Free Layer 7:** Shows significantly higher variance and specialization.
* `DM Mathematics` shows high intensity (dark red) at Experts 7, 21, 26, 43, and 55.
* `Github` shows high intensity at Experts 24, 26, and 33.
### Layer 8
* **Aux-Loss-Based Layer 8:** Very uniform, low load across all experts and data sources.
* **Aux-Loss-Free Layer 8:** Increased specialization compared to the loss-based version.
* `DM Mathematics` peaks at Experts 5, 8, 22, and 32.
* `Github` shows a distinct peak at Expert 58.
### Layer 9
* **Aux-Loss-Based Layer 9:** Uniform low load. Minor activity for `DM Mathematics` at Expert 25.
* **Aux-Loss-Free Layer 9:**
* `DM Mathematics` shows strong specialization at Experts 4, 25, 27, and 45.
* `Github` shows peaks at Experts 44 and 48.
### Layer 10
* **Aux-Loss-Based Layer 10:** Uniform low load. Minor activity for `DM Mathematics` at Expert 40.
* **Aux-Loss-Free Layer 10:**
* `DM Mathematics` shows high load at Experts 1, 26, and 58.
* `Github` shows a peak at Expert 57.
### Layer 11
* **Aux-Loss-Based Layer 11:** Uniform low load. Minor activity for `DM Mathematics` at Expert 40.
* **Aux-Loss-Free Layer 11:**
* `DM Mathematics` shows high load at Experts 8, 16, 47, and 50.
* `Github` shows peaks at Experts 24 and 45.
### Layer 12
* **Aux-Loss-Based Layer 12:** Uniform low load across the board.
* **Aux-Loss-Free Layer 12:**
* `DM Mathematics` shows moderate to high load at Experts 25, 31, 51, and 62.
* `Github` shows moderate load at Experts 11, 22, and 38.
---
## 3. Data Trends and Observations
### Trend Verification
1. **Aux-Loss-Based Trend:** Across all layers (7-12), the "Aux-Loss-Based" models exhibit a "flat" or "smeared" distribution. The color remains consistently in the light yellow range (0-2), indicating that the auxiliary loss forces the model to distribute the load evenly across all 64 experts regardless of the input domain.
2. **Aux-Loss-Free Trend:** Across all layers, the "Aux-Loss-Free" models exhibit "sparsity" and "specialization." There are clear "hotspots" (dark orange to dark red, values 6-10) where specific experts are heavily utilized for specific data sources (e.g., Expert 55 for DM Mathematics in Layer 7).
### Comparative Analysis
* **Domain Specialization:** In the "Aux-Loss-Free" charts, `DM Mathematics` and `Github` often activate different experts. `Wikipedia (en)` tends to have a more distributed, lower-intensity load compared to the other two, likely due to its broader linguistic nature.
* **Expert Utilization:** The "Aux-Loss-Free" method allows for "expert collapse" or "expert specialization" where certain experts become highly tuned to specific tasks, whereas the "Aux-Loss-Based" method prevents this by design, resulting in the uniform appearance.
---
## 4. Legend and Scale Extraction
* **Location:** Bottom center of the image.
* **Label:** `Relative Expert Load`
* **Scale Markers:** `0, 2, 4, 6, 8, 10`
* **Color Gradient:**
* **0:** Pale Yellow (#FFF9C4 approx)
* **5:** Orange (#FF9800 approx)
* **10:** Deep Red/Maroon (#800000 approx)
## 5. Axis Labels and Categories
* **Y-Axis Labels (Top to Bottom for each chart):**
1. `Wikipedia (en)`
2. `Github`
3. `DM Mathematics`
* **X-Axis Labels:** Integers from `1` to `64`, representing the Expert ID. Every integer is labeled.