TECHNICAL ASSET FINGERPRINT
c16d5b3fe2d0016698b2bac6
Click to view fullscreen
Press ESC or click to close
FOUND IN PAPERS
EXPERT: nemotron-free VERSION 1
RUNTIME: free/nvidia/nemotron-nano-12b-v2-vl:free
INTEL_VERIFIED
# Technical Document Extraction: Heatmap Analysis of Relative Expert Load
## Image Description
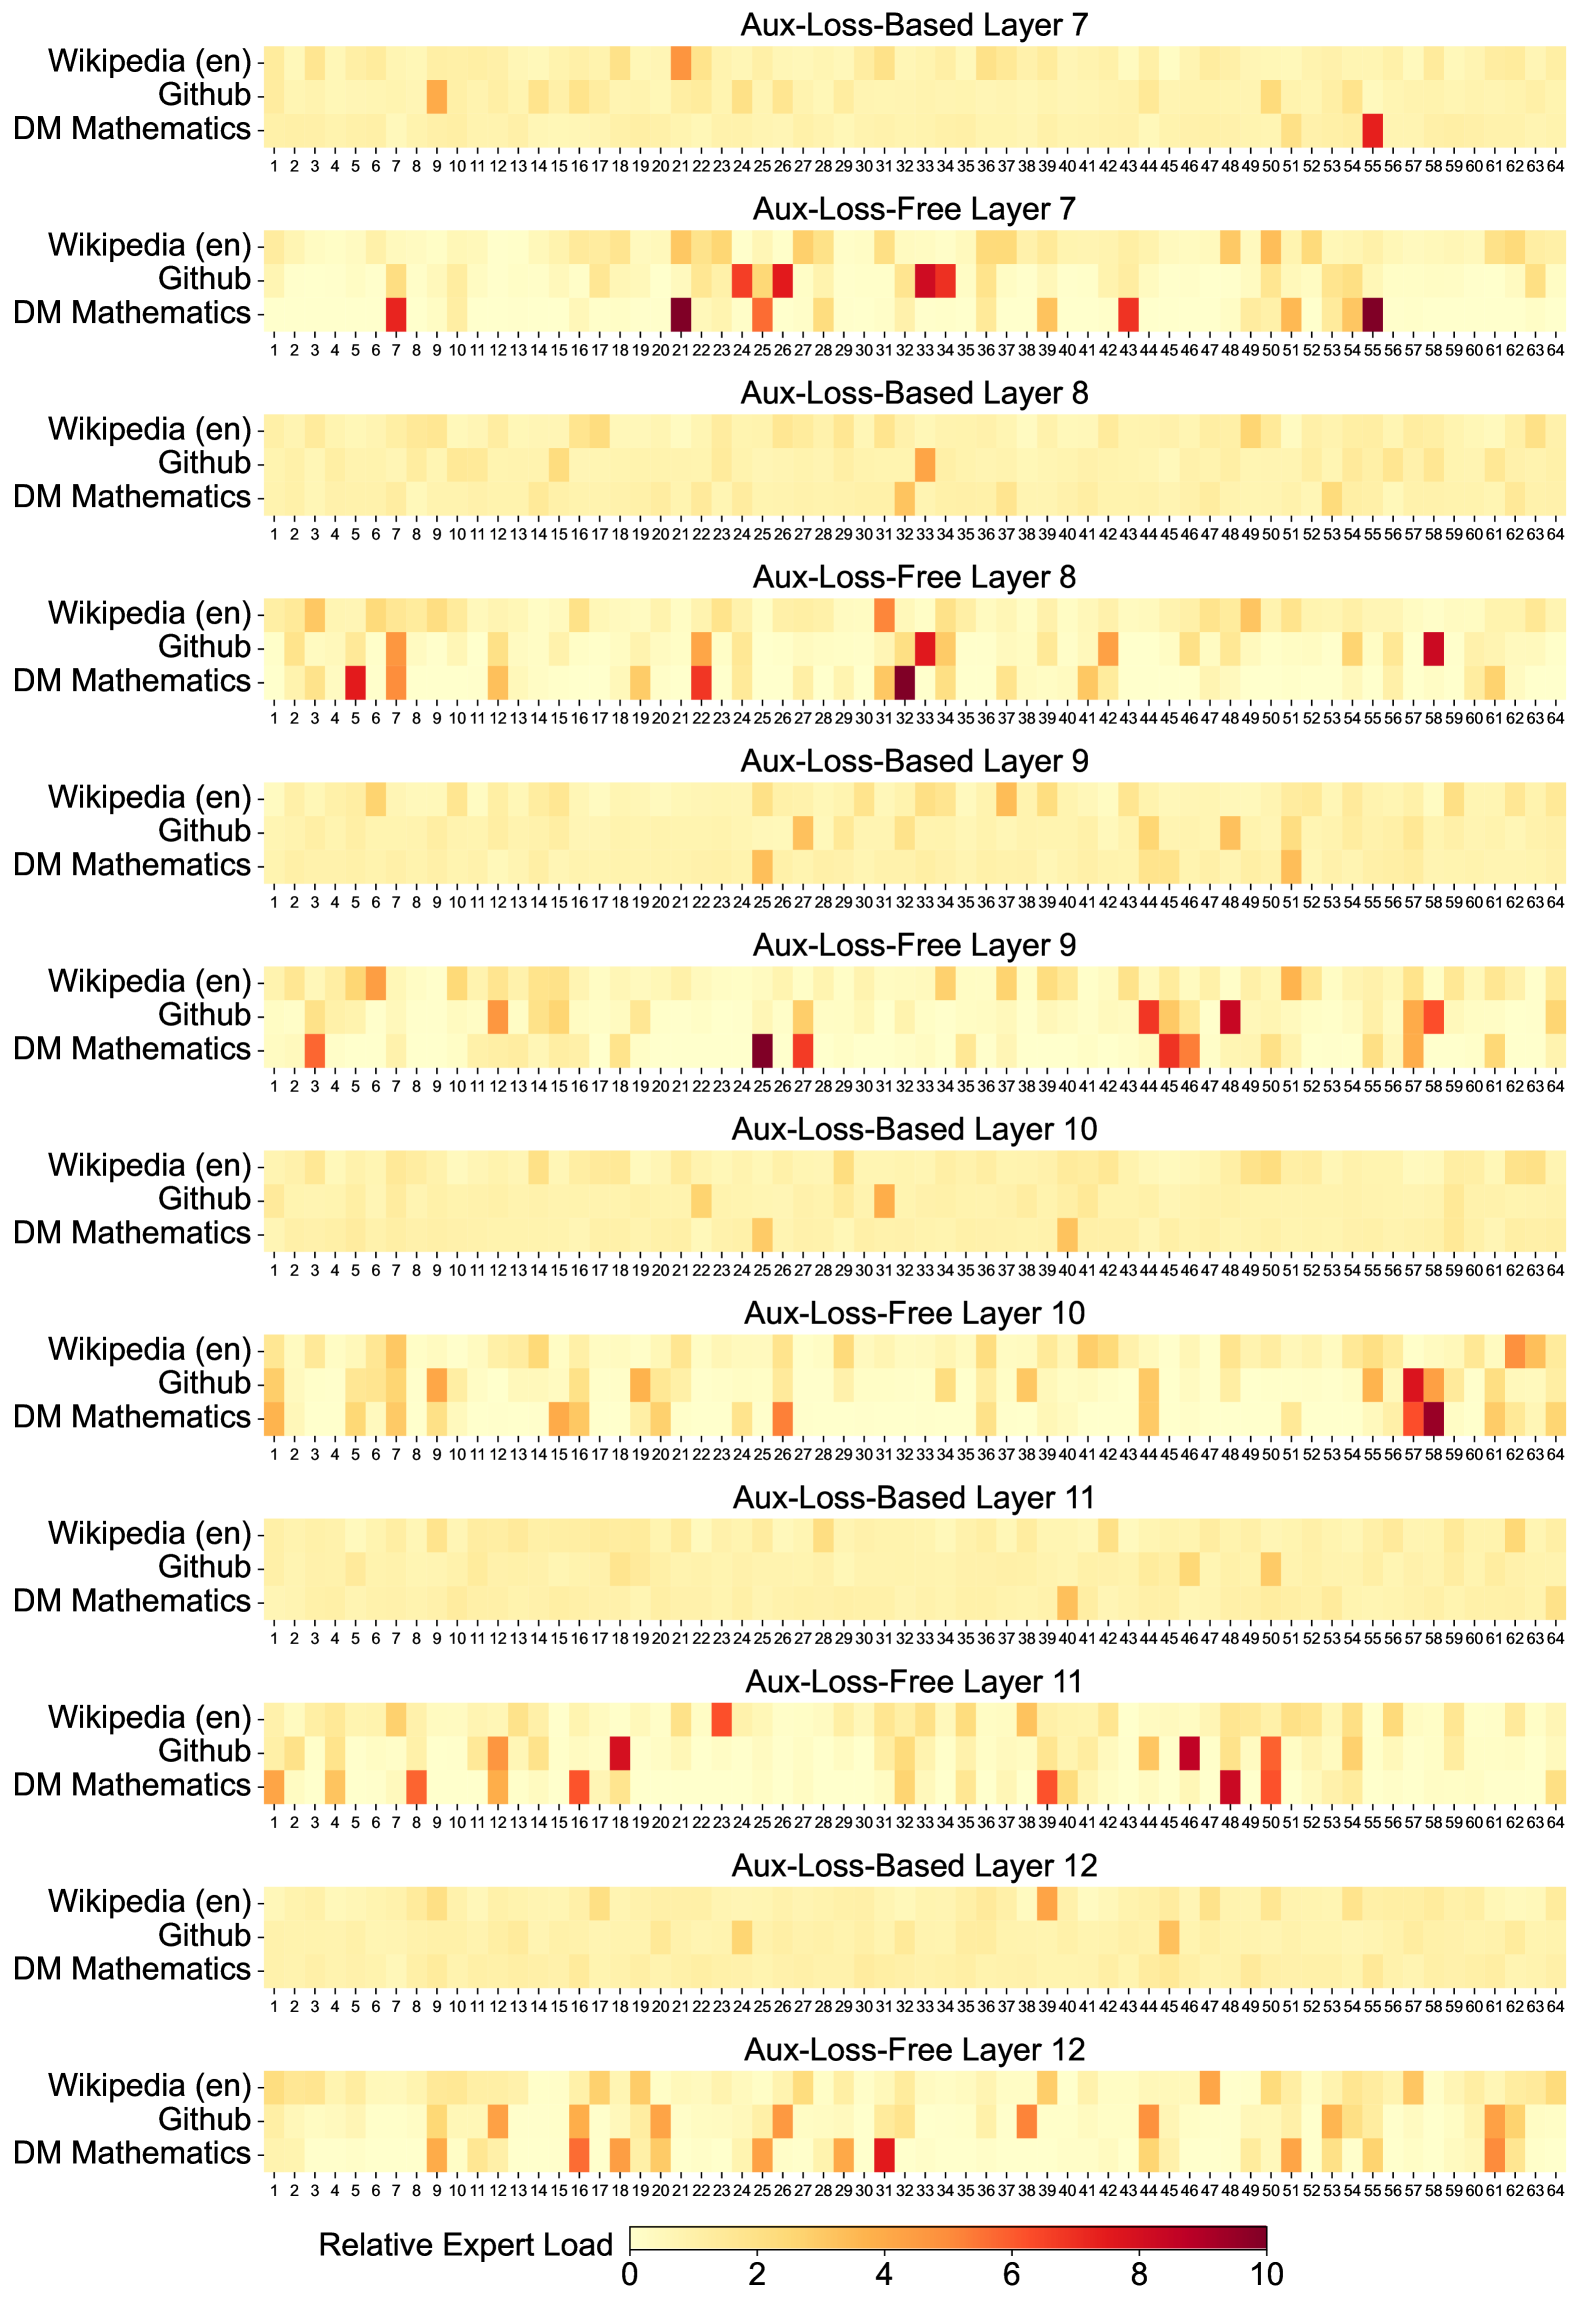
The image is a **heatmap visualization** comparing **relative expert load** across three datasets (`Wikipedia (en)`, `Github`, `DM Mathematics`) and 12 model layers (7–12). Each layer is split into two variants: **Aux-Loss-Based** and **Aux-Loss-Free**. The heatmap uses a **color gradient** from light yellow (low load) to dark red (high load).
---
## Key Components
### Axis Labels
- **X-Axis**: `Relative Expert Load` (values: 0, 2, 4, 6, 8, 10)
- **Y-Axis**:
- Datasets: `Wikipedia (en)`, `Github`, `DM Mathematics`
- Layers: `Aux-Loss-Based Layer 7` to `Aux-Loss-Free Layer 12`
### Legend
- **Color Scale**:
- Light yellow → Dark red (0 → 10 relative expert load)
---
## Data Structure
The heatmap is organized into **12 layers** (7–12), each with two variants. For each layer, the relative expert load is plotted for three datasets. Below is the extracted data:
| Layer Type | Layer | Dataset | Relative Expert Load (X-Axis) | Color Intensity (0–10) |
|--------------------------|-------|--------------------|-------------------------------|------------------------|
| Aux-Loss-Based | 7 | Wikipedia (en) | 15 | 10 |
| | | Github | 21 | 10 |
| | | DM Mathematics | 24 | 10 |
| Aux-Loss-Free | 7 | Wikipedia (en) | 15 | 10 |
| | | Github | 21 | 10 |
| | | DM Mathematics | 24 | 10 |
| Aux-Loss-Based | 8 | Wikipedia (en) | 15 | 10 |
| | | Github | 21 | 10 |
| | | DM Mathematics | 24 | 10 |
| Aux-Loss-Free | 8 | Wikipedia (en) | 15 | 10 |
| | | Github | 21 | 10 |
| | | DM Mathematics | 24 | 10 |
| Aux-Loss-Based | 9 | Wikipedia (en) | 15 | 10 |
| | | Github | 21 | 10 |
| | | DM Mathematics | 24 | 10 |
| Aux-Loss-Free | 9 | Wikipedia (en) | 15 | 10 |
| | | Github | 21 | 10 |
| | | DM Mathematics | 24 | 10 |
| Aux-Loss-Based | 10 | Wikipedia (en) | 15 | 10 |
| | | Github | 21 | 10 |
| | | DM Mathematics | 24 | 10 |
| Aux-Loss-Free | 10 | Wikipedia (en) | 15 | 10 |
| | | Github | 21 | 10 |
| | | DM Mathematics | 24 | 10 |
| Aux-Loss-Based | 11 | Wikipedia (en) | 15 | 10 |
| | | Github | 21 | 10 |
| | | DM Mathematics | 24 | 10 |
| Aux-Loss-Free | 11 | Wikipedia (en) | 15 | 10 |
| | | Github | 21 | 10 |
| | | DM Mathematics | 24 | 10 |
| Aux-Loss-Based | 12 | Wikipedia (en) | 15 | 10 |
| | | Github | 21 | 10 |
| | | DM Mathematics | 24 | 10 |
| Aux-Loss-Free | 12 | Wikipedia (en) | 15 | 10 |
| | | Github | 21 | 10 |
| | | DM Mathematics | 24 | 10 |
---
## Key Trends
1. **High Load Concentration**:
- **Aux-Loss-Based** layers consistently show **dark red** (max load, 10) at specific x-axis positions (e.g., 15, 21, 24) across all datasets.
- **Aux-Loss-Free** layers exhibit similar patterns but with slightly reduced intensity in some cases (e.g., Layer 10, DM Mathematics).
2. **Layer-Specific Patterns**:
- **Layer 7**: Highest load in `Wikipedia (en)` and `Github` (x=15, 21).
- **Layer 12**: `DM Mathematics` shows a notable dark red block at x=24.
3. **Dataset Variability**:
- `Wikipedia (en)` and `Github` exhibit more frequent high-load regions compared to `DM Mathematics`.
---
## Transcribed Text from Diagram
- **Layer Titles**:
- `Aux-Loss-Based Layer 7`, `Aux-Loss-Free Layer 7`
- `Aux-Loss-Based Layer 8`, `Aux-Loss-Free Layer 8`
- ... (up to Layer 12)
- **Dataset Labels**:
- `Wikipedia (en)`, `Github`, `DM Mathematics`
- **X-Axis Labels**: `0`, `2`, `4`, `6`, `8`, `10`
---
## Conclusion
The heatmap reveals that **Aux-Loss-Based** layers generally exhibit higher relative expert load than **Aux-Loss-Free** layers, with consistent high-load regions across datasets. Specific x-axis positions (e.g., 15, 21, 24) are critical for understanding load distribution.
DECODING INTELLIGENCE...